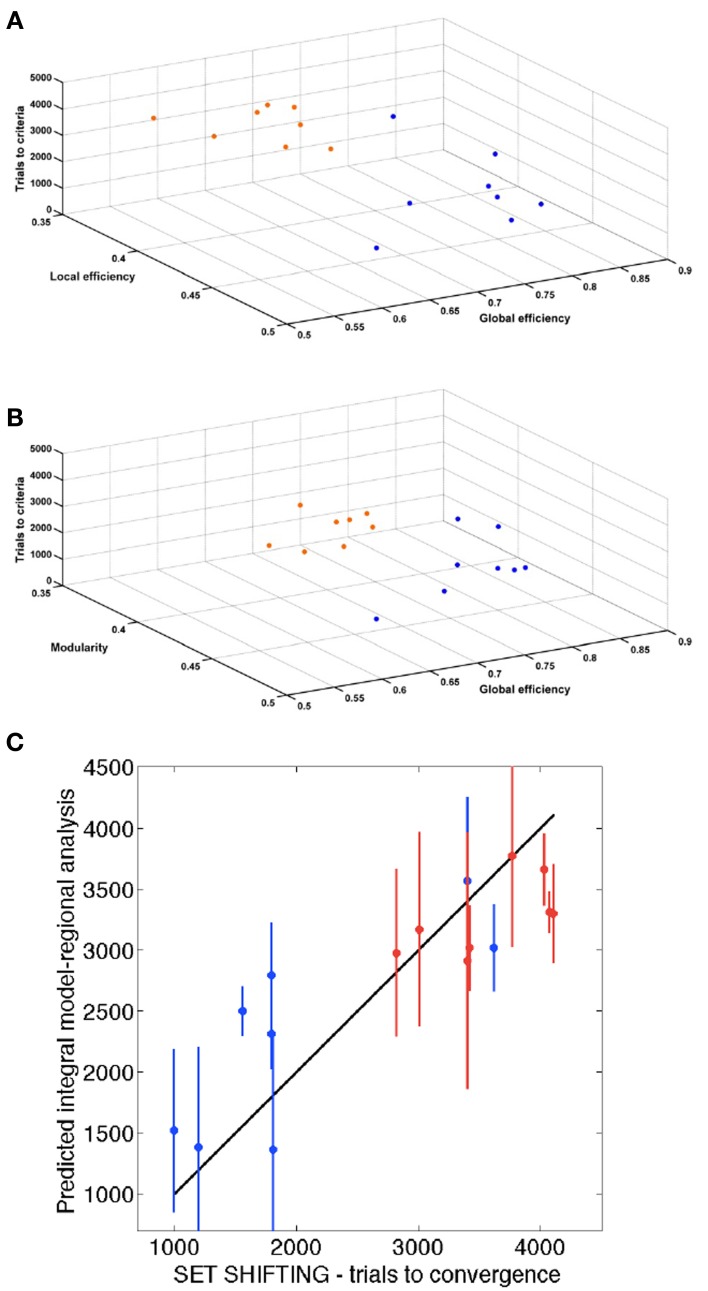
Figure 7.
Association of behavior and connectivity indices. (A,B) Scatter plots representing all the animals with the number of trials required to reach criteria in the set-shifting test on the Y axis, and the connectivity indexes in the X and Z axis. Blue dots represent control animals and orange dots represent SHR. (C) Estimation of the final behavioral flexibility score of each animal based on the connectivity indexes at 10 weeks.

