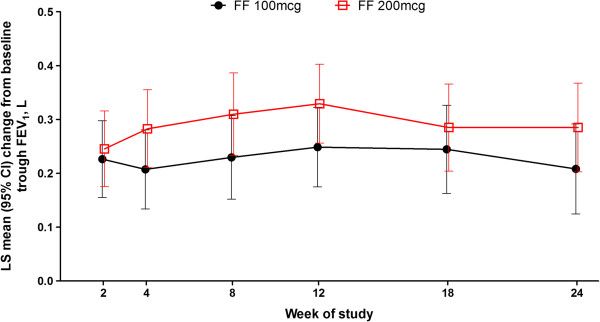
Figure 2.

Repeated-measures analysis of change from baseline in trough FEV1 (L) over 24 weeks of treatment (intent-to-treat population). Note: repeated measures analysis adjusted for baseline, region, sex, age, treatment, visit, visit by baseline interaction, visit by treatment interaction. CI = confidence interval; FF = fluticasone furoate; LS = least squares.
