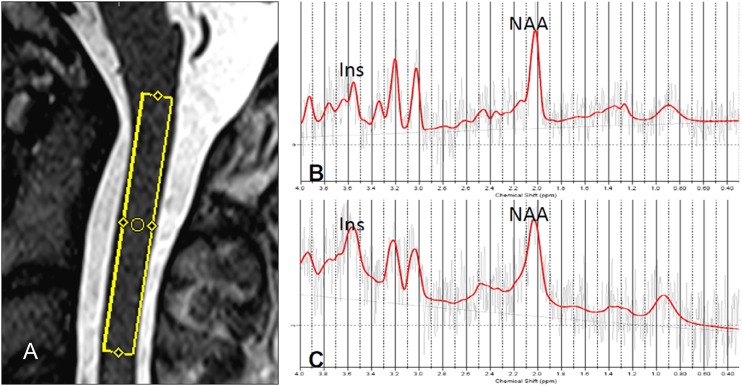
Figure 1.
(A) Location of the spectroscopic voxel between C1 and C3 on the T2-weighted sagittal image of one control. (B) Spectrum derived from voxel in (A) that shows reduced myo-inositol (m-Ins)/creatine and phosphocreatine (Cr) ratio (1.37 [%SD = 11]) in comparison with a spectrum obtained in a patient (m-Ins/Cr = 2.11 [%SD = 10]) (C).

