
Figure 2.
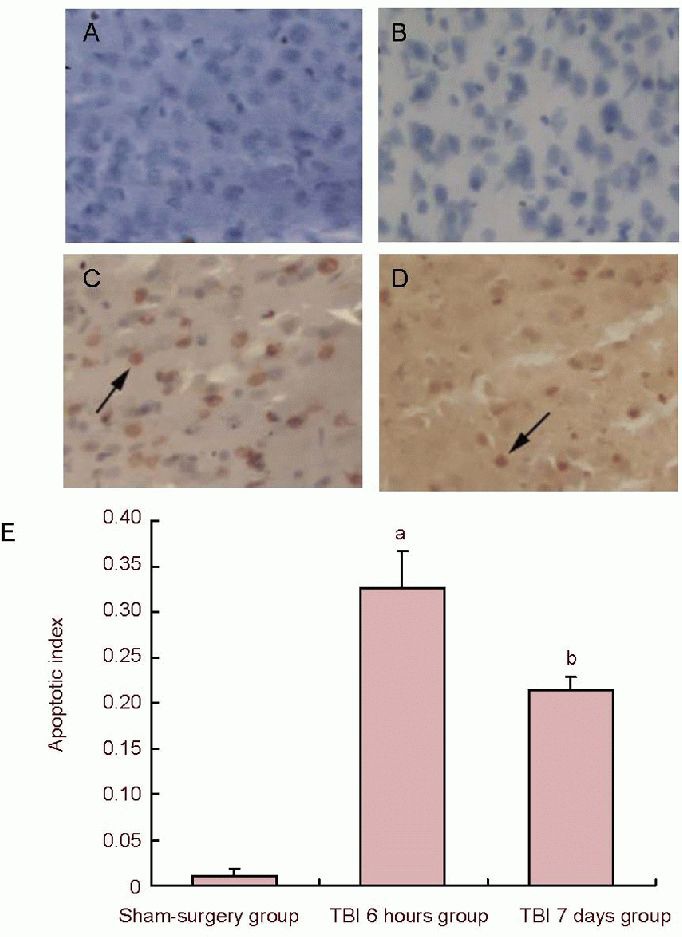
Cell apoptosis in the peripheral area of the cerebral cortex in traumatic brain injury (TBI) rats (TUNEL staining).
(A) Cell apoptosis of negative control (× 200); (B) morphology of apoptotic cells in the sham-surgery group (× 200); (C) cell apoptosis at 6 hours post injury (× 200); (D) morphology of apoptotic cells at 7 days post injury: the number of apoptotic cells was markedly reduced when compared to 6 hours post injury; arrows in C and D show brown positive apoptotic cells with thickening nuclei.
(E) Quantification of TUNEL-positive cells. Data represent the change in cellular apoptosis index in all experimental groups (apoptosis index = number of TUNEL-positive cells/total number of cells). aP< 0.05, vs. sham-surgery group; bP< 0.05, vs. TBI 6 hours group. Data are expressed as mean ± SD of 10 rats from each group (one-way analysis of variance and least significant difference t-test). TUNEL: Terminal deoxynucleotidyl transferase-mediated dUTP-biotin nick end labeling.