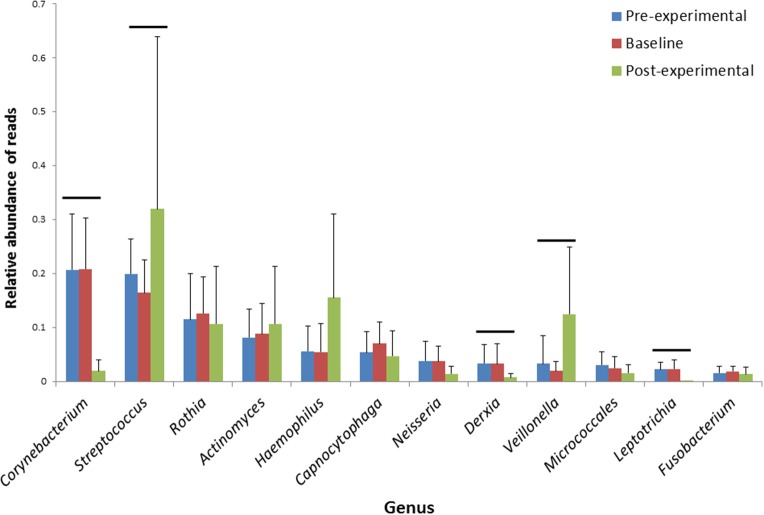
Figure 3.
Average proportions of major genera from dental plaque samples collected at pre-experimental, baseline and the post-experimental visit. Error bars—standard deviations. Horizontal lines indicate statistically significantly different proportions of reads of the respective genera between the post-experimental and the other two visits (p < 0.05, Wilcoxon signed ranks test, after Bonferroni correction for multiple comparisons). N = 19.

