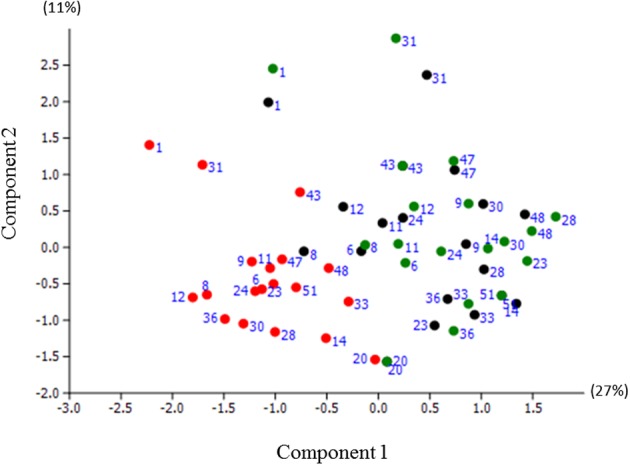
Figure 4.

Principal Component Analysis (PCA) plot of microbiome samples from pre-experimental visit (black dots); baseline of the experimental period (green dots) and post-experimental visit (red dots). The first component (PC1) explained 27% of the total variance, the PC2—11%. The same labels indicate samples that originated from the same individual.
