
Figure 4.
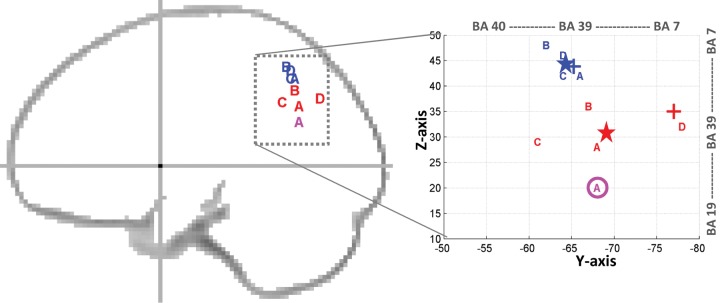
Projection of Montreal Neurological Institute (MNI) coordinates of previous angular gyrus (AG) subdivisions on a schematic sagittal outline (left, at x = −30 mm) and a zoom centered at the AG (right). A = Seghier and others (2010), B = Nelson and others (2010), C = Price GR and Ansari (2011), and D = Sharp and others (2010). Dorsal coordinates are shown in blue and ventral coordinates are shown in red. A third more ventral subdivision at z = +20 mm is shown in magenta (according to Seghier and others 2010). Average locations are illustrated with a star (blue for dorsal subdivision at [x = −35, y = −64, z = 45], red for ventral subdivision at [x = −42, y = −69, z = 31]). The average locations here are remarkably similar to the two subdivisions used in a recent seed-based resting-state functional connectivity study over a large sample of 1000 subjects (noted as PGpd and PGpv in Table 4 and Figure 30 of Yeo and others 2011). Approximate location of the center of gravity of cytoarchitectonic areas PGa and PGp (Caspers and others 2008) is indicated by “+” in blue and red, respectively. BA = Brodmann area.