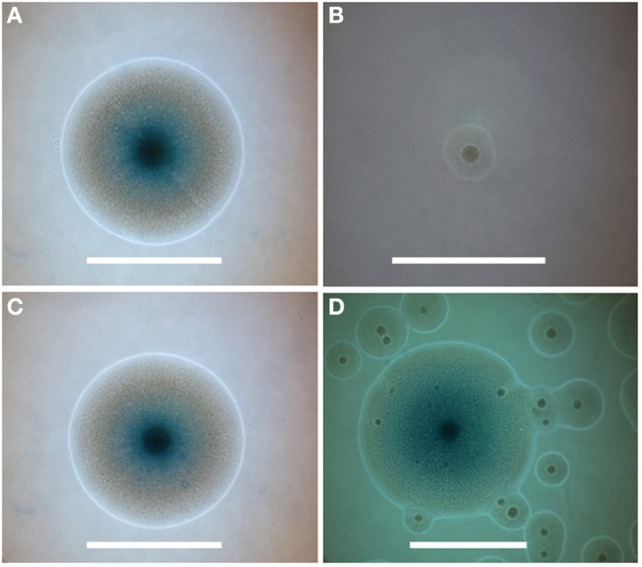
Figure 7.

Colony phenotypes associated with nusG deletion and rescue. (A–C) Individual colonies were photographed 72 h after plating on agar medium from sparse fields where colony growth would be unaffected by neighboring colonies. Colonies represent (A) JCVI-syn1.0, (B) JCVI-syn1.0 ΔL, and (C) complemented clone ML1. (D) represents a field of colonies from the second culture in Figure 4, showing the initial emergence of the faster growing colonies among the more prevalent smaller colonies within the population derived from transformation of JCVI-syn1.0 ΔL using the marker-less approach. Centers of colonies display the typical mycoplasma “fried-egg” characteristic. Blue color is from expression of lacZ in medium containing X-gal (smaller colonies had not yet developed color at the time of assay). Bars represent 500 μm.
