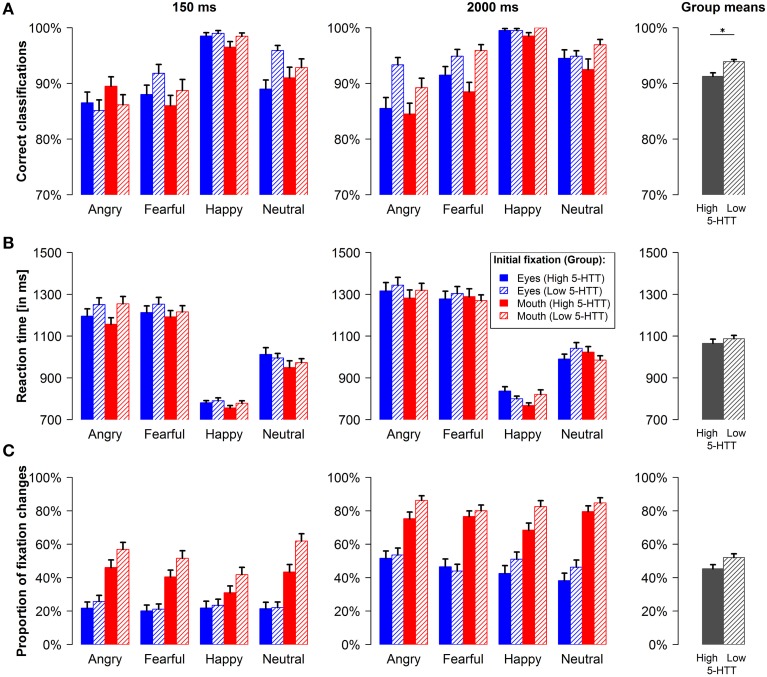
Figure 2.
Behavioral data and fixation changes. Proportion of correct emotion classifications (A), reaction times (B) and proportion of reflexive upward and downward fixation changes (C) for the short and the long presentation time are shown for every condition and pooled across conditions for the two genotype groups (group means, rightmost column). Error bars indicate s.e.m. *p < 0.05.

