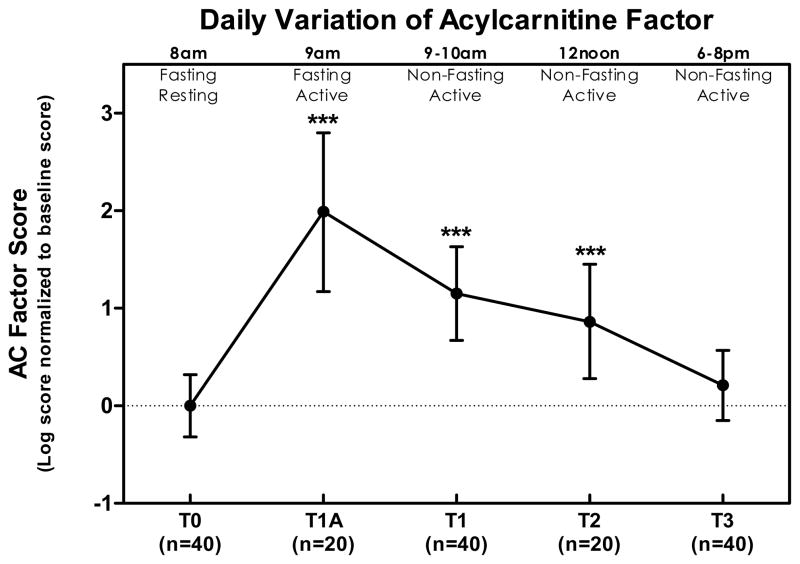
Figure 2. Daily profile of 1-factor solution scores for 45 acylcarnitines (AC) at various time points as a ratio of the baseline value.
All values are normalized to concentrations at T0 and represent natural log means and 95% confidence interval. Change from baseline was statistically significant at T1a (p < 0.0001), T1 (p < 0.0001), T2 (p = 0.0056), but not T3 (p = 0.3). Summarized in the figure as * p < 0.05, ** p < 0.01, and *** p < 0.001.

