
Table 3.
Within subject (daily) variation in 15 amino acids -nearest neighbor ratios.
| ||||
|---|---|---|---|---|
| 1. Glycine | 1.00 | 1.03 | 1.08 * | 0.99 |
| 2. Alanine | 1.02 | 1.18 *** | 1.15 *** | 1.05 * |
| 3. Serine | 1.06 | 1.12 ** | 1.02 | 1.04 |
| 4. Proline | 0.96 * | 1.20 *** | 0.98 | 1.12 * |
| 5. Valine | 1.00 | 1.08 * | 1.00 | 1.01 |
| 6. Leucine/Isoleucine | 1.02 | 1.16 *** | 1.01 | 1.03 |
| 7. Methionine | 1.01 | 1.13 *** | 1.02 | 0.94 |
| 8. Histidine | 0.99 | 1.05 * | 0.98 | 1.01 |
| 9. Phenylalanine | 1.04 * | 1.12 *** | 1.01 | 0.99 |
| 10. Tyrosine | 1.04 ** | 1.08 *** | 0.99 | 0.94 |
| 11. Aspartate/Asparagine | 1.15 *** | 1.05 | 1.04 | 1.08 |
| 12. Glutamate/Glutamine | 1.09 ** | 0.95 | 1.12 *** | 0.96 |
| 13. Ornithine | 0.99 | 1.02 | 0.92 | 0.98 |
| 14. Citrulline | 1.02 | 0.84 *** | 0.92 | 0.94 |
| 15. Arginine | 1.09 *** | 1.08 * | 1.11 * | 1.04 |
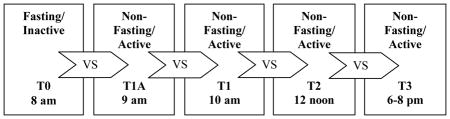
For each subject, the ratio of each time point relative to its previous time point was calculated using log-transformed (ln) values. Median values of the individual ratios are presented and P values (where the null hypothesis is that the overall ratio = zero) were generated by the Signed Rank Statistic. P values:
*
p<0.05,
**
p<0.01,
***
p<0.001.