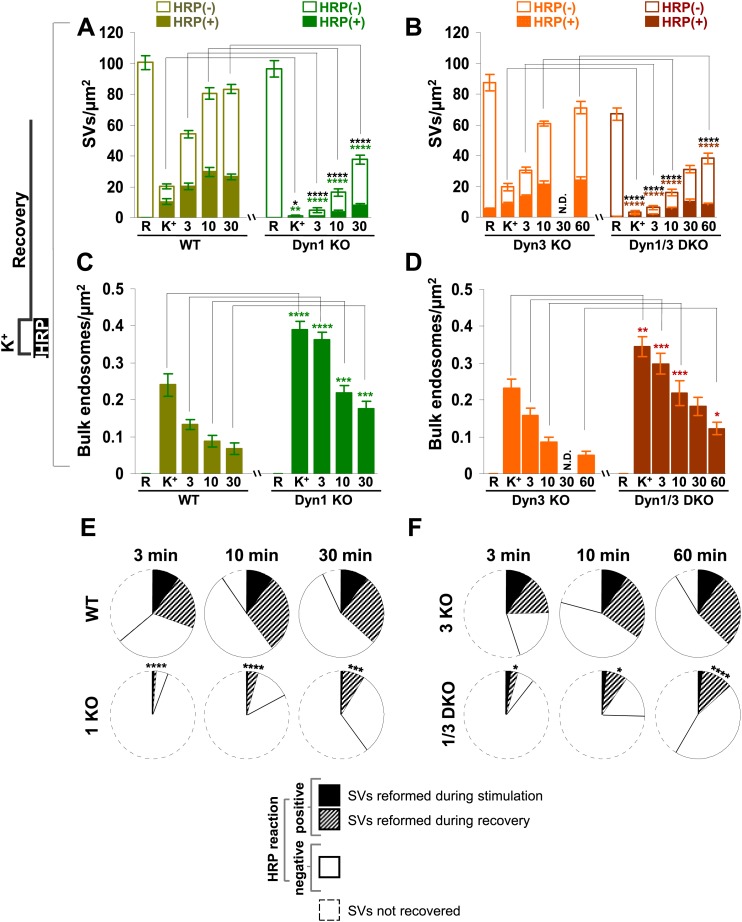
Figure 4. Quantification of SV number and bulk endosome dynamics, as assessed by soluble HRP labeling, in WT and dynamin KO neurons in response to high K+ stimulation.
These data represent a quantification of the experiments used for Figure 3. (A and B) Analysis of SV number per cross-sectional area of nerve terminal under resting conditions (R), at the end of the 90 s high K+ stimulus (K+), and after recovery for the times indicated. SVs positive for HRP reaction product are indicated by the dark portion of each bar. (C and D) Analysis of the membrane area of HRP reaction product-positive bulk endosomes per cross-sectional area of nerve terminal in each of the conditions investigated. (E and F) Pie charts summarizing results of fields A and B concerning the reformation of SVs at different times after recovery. Entire pie: total SVs before stimulation; white sector: unlabeled SVs; black sector: labeled SVs after stimulation; striped section: total labeled SVs subtracted by the SVs formed during stimulation. ****, ***, **, * indicate p-values of <0.0001, <0.001, <0.01, and <0.05, respectively. N.D., ‘not determinated’. Black asterisks refer to comparisons between total vesicles, colored asterisks to comparisons between HRP-labeled vesicles. Bars: standard error of the mean.

