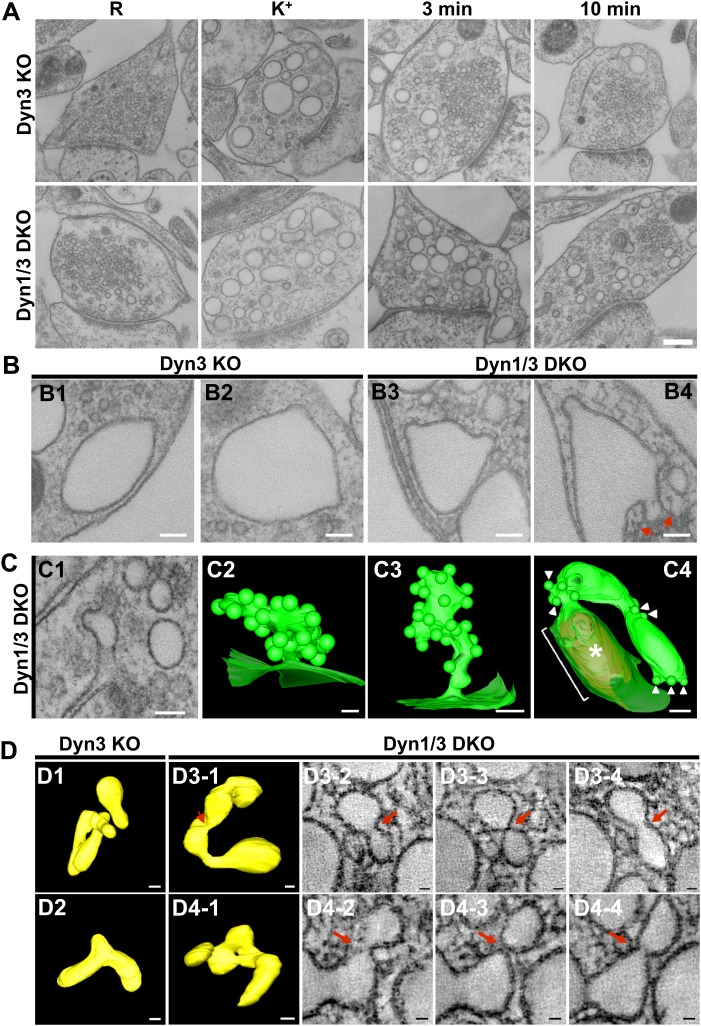
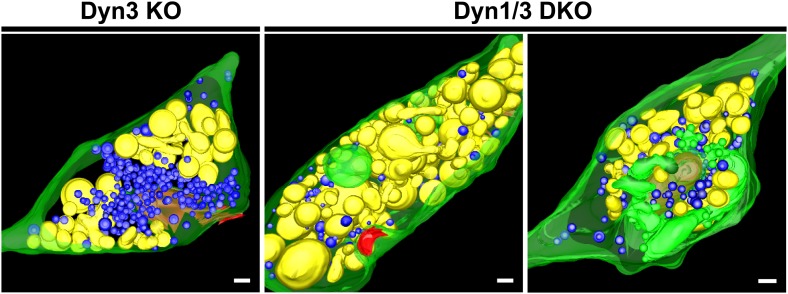
Figure 9. EM analysis of bulk endosomes from high pressure-frozen/freeze-substituted specimens.
Neuronal cultures were incubated overnight in TTX and then exposed to 90 s stimulation in high K+ and recovered for 3 and 10 min. (A) Representative examples of Dyn3 KO (control) and Dyn1/3 DKO synapses. (B) Gallery of coated buds on vacuole-like structures: note the connection to the plasma membrane in B4 (red arrows). (C) CCPs on PM invaginations at Dyn1/3 DKO synapses. C1, EM micrograph; C2-C3, 3-D models from tomograms illustrating CCP trees; C4, CCPs (white arrowheads) on a dilated PM invagination. A white bracket and an asterisk indicates the portion of the PM directly apposed to the postsynaptic membrane (red) which is visible through the transparent green presynaptic plasma membrane. (D) Constricted bulk endosomes. Serial images D3-2 to D3-4 show constrictions and serial images D4-2 to D4-4 show constrictions and a fenestration. Red arrows point to membrane discontinuities. Scale bars: A, 250 nm; B and C1, 3 and 4, 100 nm; C2, 50 nm; D, 50 nm (3D), 20 nm (single images).


