Figure 3.
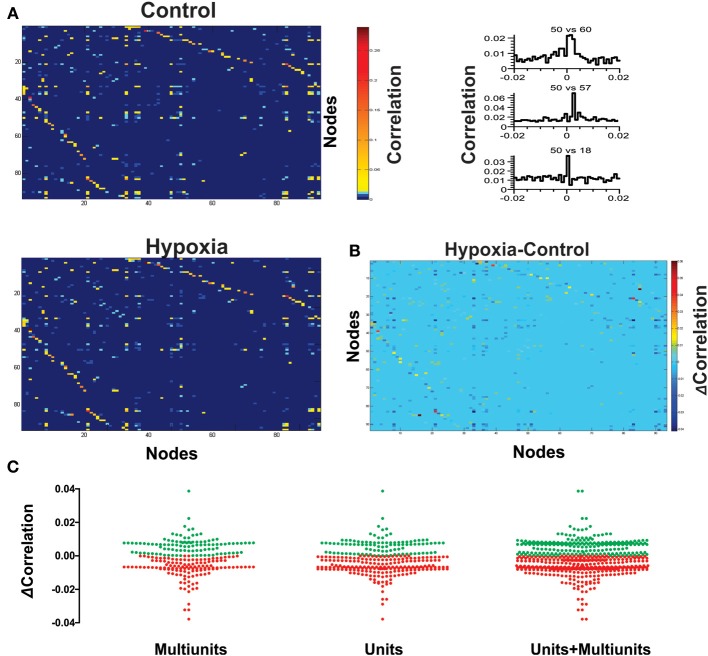
Hypoxia reconfigures the functional interactions among the respiratory elements. (A) Examples of cross-correlograms of the activity recorded between elements are presented on the right. All significant pair-wise-possible correlations are represented as correlation matrices on the left for a representative slice in control and during hypoxic conditions; a pseudocolored scale indicates that different pairs are correlated to different extents. (B) Subtraction of correlation values of the matrices represented in (A). Color scale indicates the extent of change of correlation values (Δ Correlation). Note that the correlation increases for a few pairs of respiratory elements, but it decreases for most of them. (C) The graph shows a pair to pair change in correlation under hypoxia conditions (ΔCorrelation) represented in the matrix of panel (B). Data are grouped as unitary, multi-unitary, or both. Increase in correlation is denoted by green dots, decrease by red dots.

