
Figure 4.
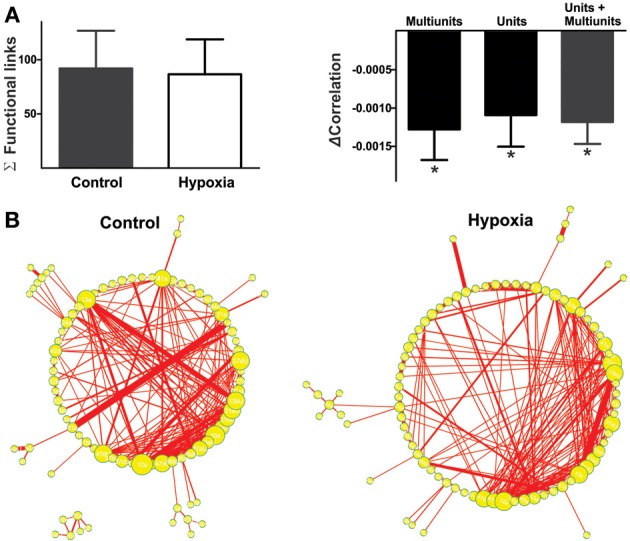
The reconfiguration of the respiratory network in hypoxia does not imply a loss of functional links but a reduction in their strength. (A) Left: Histogram of the number of links in the respiratory network, indicating functional connectivity between elements did not change significantly with hypoxia. Right: Histogram of the change in correlated firing among elements between normoxic and hypoxic conditions, showing a significant reduction in correlation for all classes of respiratory recording elements: multi-unitary, unitary and both (*p < 0.05). (B) Graphic representation of respiratory network configurations in normoxic and hypoxic conditions. Each respiratory element is represented as a circle and each significant correlation between two elements is represented as a connecting line (functional link). The diameter of the circles is proportional to the number of functional links that each element has with other elements in the network. The width of the line is proportional to the correlation value of a given link. Note that the reconfiguration of the respiratory network in hypoxia is not due to a loss in the number of respiratory elements or of their functional links, but to a reduction in the strength of such links.