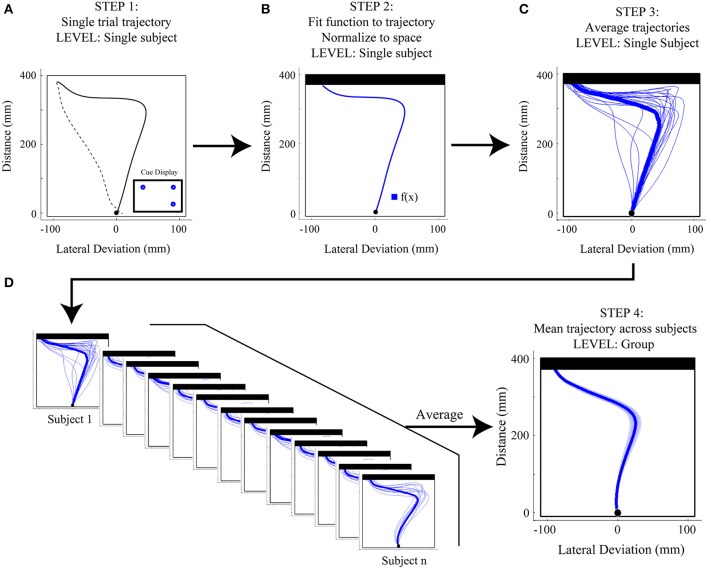
Figure 3.
Step-by-step overview of Functional Data Analysis (FDA) methods. (A) Step 1: Single trial reach trajectories are extracted for a particular experimental condition [in the case here, a 1(high)v2 target display with the target on the left cued]. The full trajectory is denoted by a dashed black line and includes the hand returning to the start position, while the extracted reach is denoted by a thicker solid black line and includes only the movement of interest, from start position to touch screen. (B) Step 2: The single trial reach trajectory is then fit with a mathematical function [f(x)] and is then normalized to space (in the case here, with respect to touchscreen distance). The resulting space-normalized trajectory is denoted by the thicker blue trace. (C) Step 3: Single trial trajectories belonging to the same experimental condition are averaged, producing a single-subject average trajectory. Single trial trajectories are denoted by thin blue traces and the single-subject average trajectory is denoted by the thick blue trace. (D) Step 4: The single-subject average trajectories (at left) are then averaged across subjects to produce a mean group-level trajectory for the particular experimental condition (shown at right). At right, the shaded area around the darker trajectory represents the average standard error across subjects.

