Figure 5.
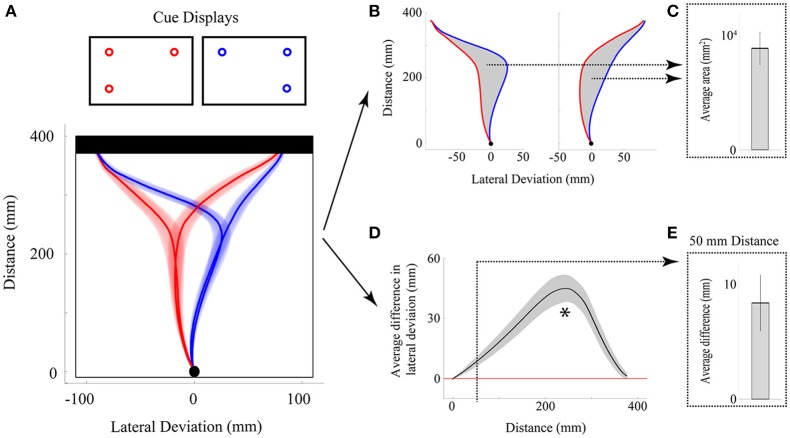
Illustration of experiment results using non-functional measures. (A) Overhead view of the group-averaged reach trajectories toward mirror displays [2v1(high) in red; 1(high)v2 in blue] for cases in which the top left or top right target positions were cued. Note that the direction of the initial movement trajectory is independent of which target position (top left or top right) is actually cued at movement onset. (B,C) Analysis of the average area between trajectory traces. The area between reach trajectories [gray shading in (B)] is computed for each reach endpoint position [top left or top right, (B)], averaged across endpoints and then individuals, and then plotted in bar graph form [in (C)]. Statistical significance is assessed by comparing the group-averaged area values to zero. Error bar shows the 95% confidence interval and, when above zero, denotes that the average areas between trajectories differed significantly (p < 0.05). (D,E) Analysis of the average lateral deviation between trajectory traces. The difference between reach trajectories over the entire distance of the movement is computed for each reach endpoint position and then averaged across endpoints and then individuals [black trace in (D)]. Gray shading around black trace in (D) shows 95% confidence intervals and, when above zero, denote that trajectories significantly (p < 0.05) diverged. Asterisk denotes the maximum lateral deviation difference observed (~60% of reach distance). The average lateral deviation difference at a time point of 50 mm distance is extracted and then plotted in bar graph form [in (E)]. Statistical significance is assessed by comparing the group-averaged deviation values to zero. Error bar in (E) shows the 95% confidence interval and since it is above zero, it denotes that the lateral deviation difference was significant (p < 0.05) even at this very early point in the reach.

