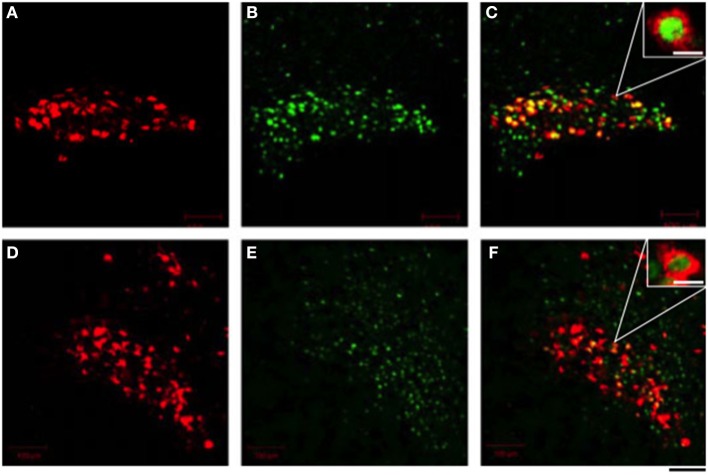
Figure 2.
Effects of i.p. administration of cholecystokinin-8 on the endogenous fluorescence of monomeric red fluorescent protein 1 (mRFP1) (A,D) and nuclear enhanced green fluorescent protein (eGFP) (B,E) in the supraoptic nucleus (A–C) and the paraventricular nucleus (D–F). The merged view of fluorescence of mRFP1 and eGFP was seen as a yellow color (C,F). Scale bars shown in white represent 10 μm in (C,F). The scale bar shown in black = 40 μm. Modified with permission from Figure 3 in Katoh et al. (2014).

