
Figure 4.
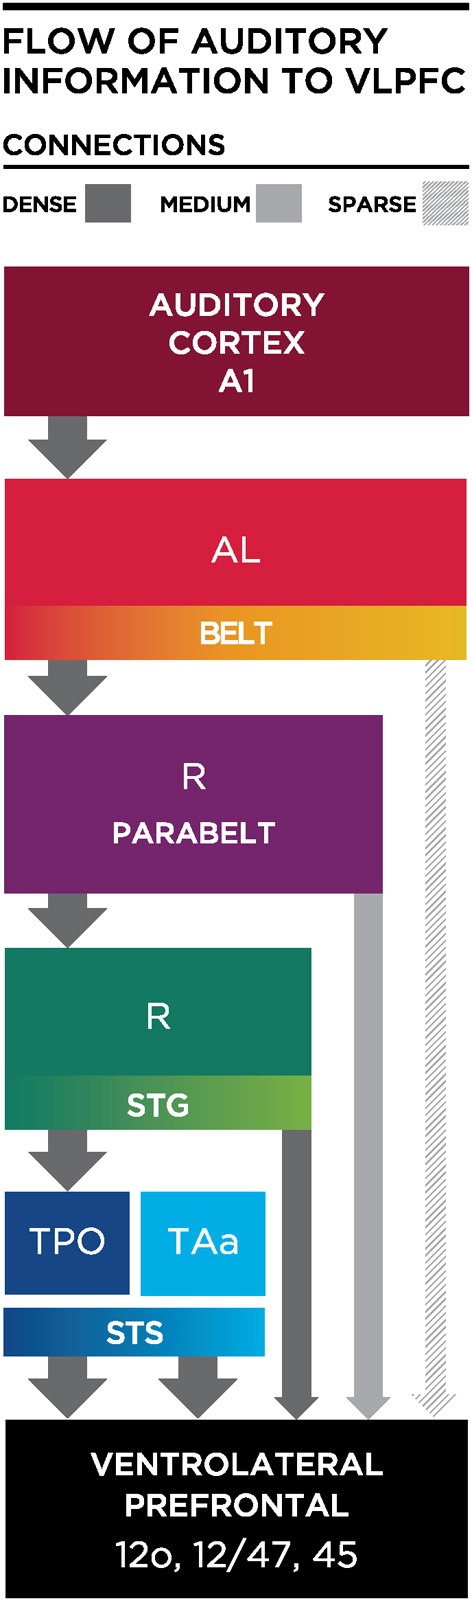
Schematic diagram illustrating the flow of information from the auditory cortex to the VLPFC. Thick and dark gray arrows illustrate dense projections from STS, with less dense projections arriving from parabelt and lateral belt regions. AL, Antero-lateral; R, Rostral; STS, Superior Temporal Sulcus; STG, Superior Temporal Gyrus; TPO, temporal parieto-occiptal area; TAa, Temporal area.