
Figure 5.
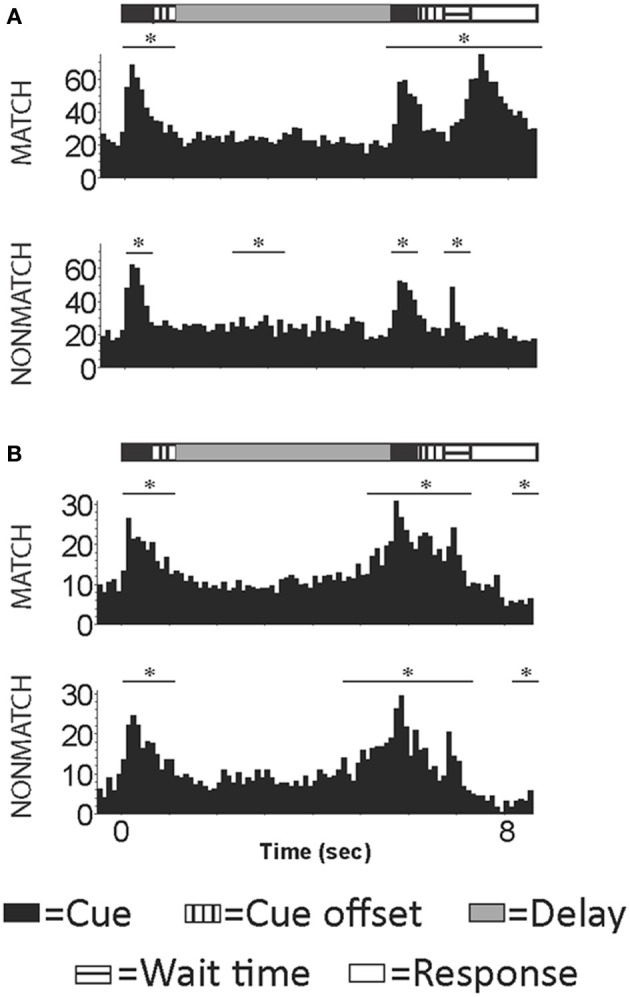
Example cells with activity occurring during the presentation of the auditory sample, match/nonmatch and during the decision period of an auditory delayed match-to-sample task. (A) An example cell with increased activity during the auditory cues, wait time and response periods for correct trials. (B) An example cell with increased firing rated during auditory cue and wait time periods for correct trials. Y-axis label is frequency (imp/s); bin = 100 ms; asterisk signifies significant change in firing rate from baseline.