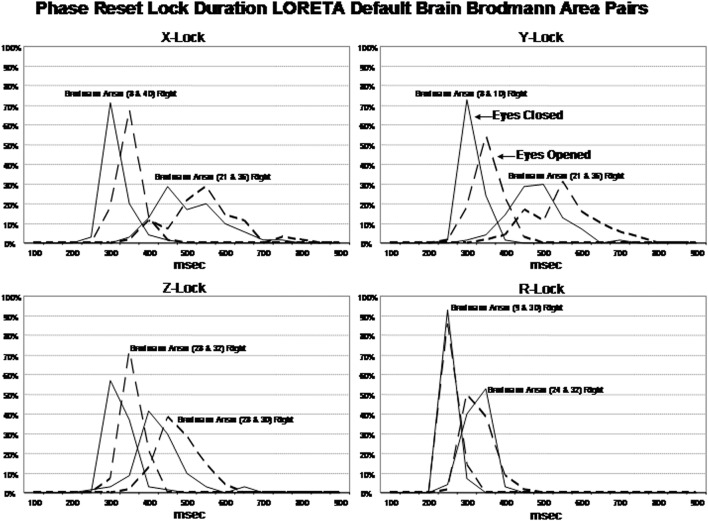
Figure 4.
Phase lock durations between Brodmann areas in the x, y, z LORETA time series directions and the resultant vector in the lower right where . The x-axis is phase lock duration in milliseconds and the y-axis is the percent of subjects that exhibited a given phase lock duration for different Brodmann area pairs. The solid line is the eyes closed condition and the dashed line is the eyes open condition. All of the subjects are represented within each curve. For example, 100% of the subjects exhibited a phase shift duration between 250 and 500 ms for Brodmann areas 8 and 10 (upper left panel x-lock) and similarly for each Brodmann area pair. The finding of discrete phase lock durations with none or little overlap of data points under each phase lock duration curve was a dominant feature of phase lock duration and demonstrates discrete “temporal quanta.”

