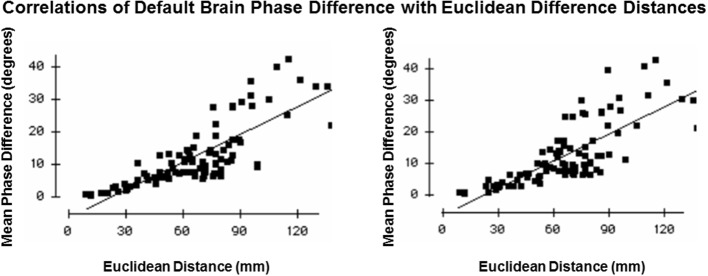
Figure 6.

Test of volume conduction. The y-axis is the mean absolute phase differences (degrees) of the resultant vector between Brodmann areas. The x-axis is the Euclidian distance (mm) between all Brodmann area pairs. The left graph is from the left hemisphere and the right graph is from the right hemisphere.
