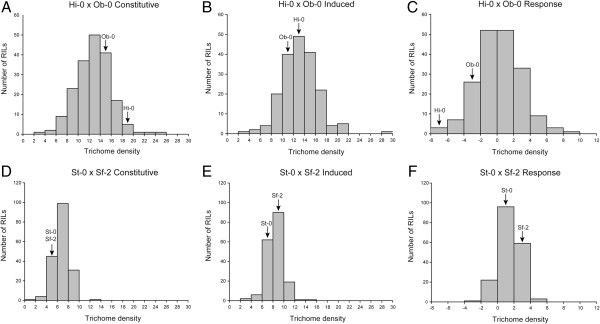
Figure 2.

Distribution of constitutive and induced trichome densities and response to damage for the Hi-0 x Ob-0 (A-C) and St-0 x Sf-2 (D-F) RILs and population parents. Labelled arrows indicate the parental phenotypes’ positions in each distribution. Note that the Hi-0 and Ob-0 accessions and some proportion of RILs in both populations have negative responses to leaf damage.
