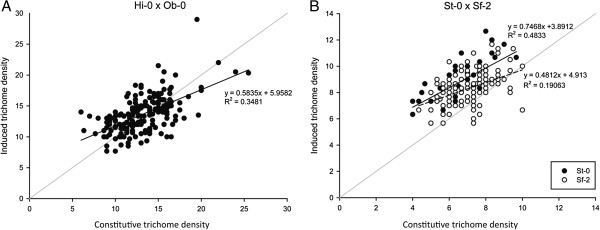
Figure 4.

Scatterplots for constitutive versus induced trichome density in the Hi-0 x Ob-0 (A) and St-0 x Sf-2 (B) RIL populations. Because a QTL was mapped for the response phenotype in the SS population, those data were partitioned according to the allele carried by individual RILs at the marker nearest the response QTL. The gray diagonal indicates a slope of 1 on each graph; any point above the line therefore reflects RILs with a positive response to leaf damage (i.e., they increase trichome density) and any point that lies beneath the line are negative responders, which reduce trichome density in response to leaf damage. Separate regression equations and R2 values are shown for the two SSR1 genotypes in the SS population; the regression equation for the entire SS population is y = 0.543x + 4.7466 with an R2 = 0.2406.
