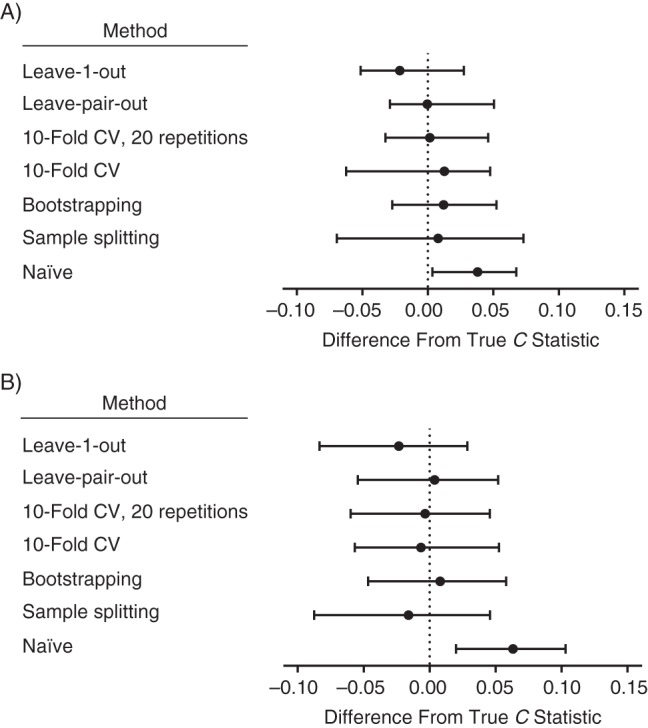
Figure 1.

The medians and interquartile ranges of the difference between the C statistic estimated using different methods and the true C statistic for A) 50 small Down syndrome data sets and B) 150 small cesarean delivery data sets. The data are United Kingdom Down syndrome screening results from Glasgow (1991–2003), Edinburgh (1999–2003), and Cambridge (1990–2006), as well as Scottish national pregnancy discharge data (2004–2007)). Bars, 95% confidence intervals. CV, cross-validation.
