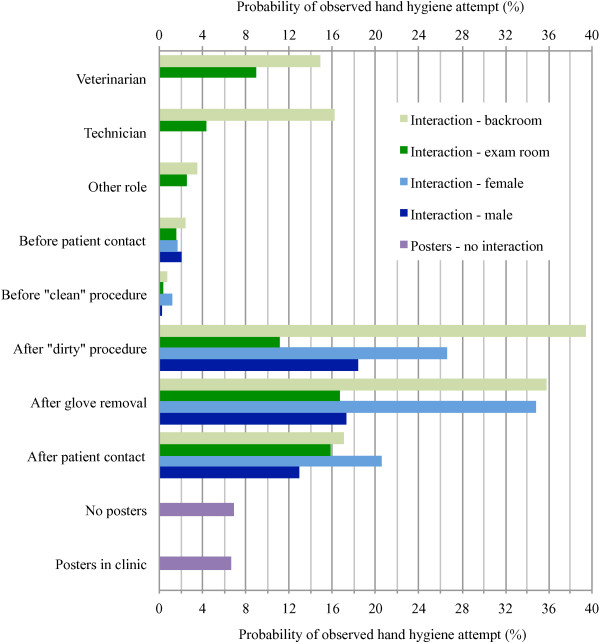
Figure 2.
Probabilities of hand hygiene compliance as per the final logistic regression model (n = 10894). Interactions indicate the effect of the variables listed on the y-axis (e.g. role: veterinarian, technician, other role) differed according to the interaction variable (e.g. room: backroom vs exam room).

