Figure 3.

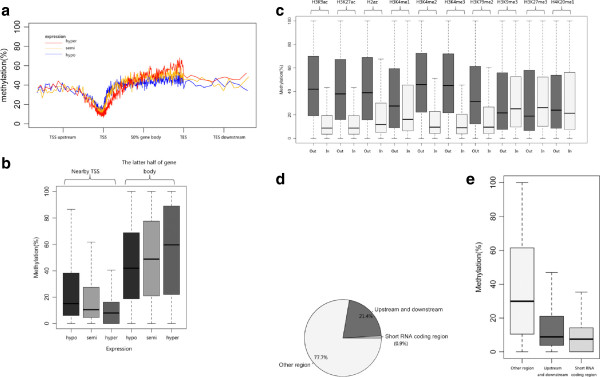
DNA methylation levels closely correlate with gene expression, histone modification and short RNA expression. (a) The methylation level of genes with high (red line), medium (orange line) and low (blue line) expression levels. (b) The TSS region and latter half of the gene body show differential DNA methylation levels that correspond to gene expression level. (c) Comparison of DNA methylation levels within and without differentially histone bound regions. The histone modifications analyzed include histone acetylation and methylation. (d) The percentage of CCGG sites located in and near short RNA coding regions. (e) The overall methylation level of CCGG sites that are within, near and without short RNA coding regions.
