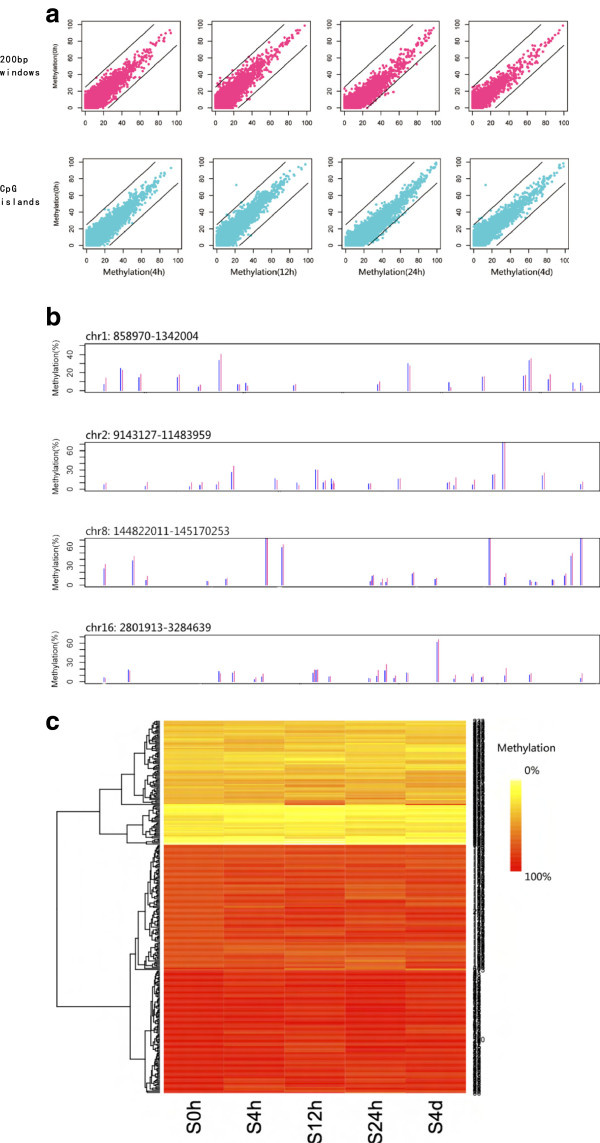
Figure 4.
Comparison of genome-wide DNA methylation of A549 cells before and after EMT. (a) The average methylation level of 200-bp windows (violet red dots) and CGIs (cyan dots) of S4h, S12h, S24h and S96h compared with S0h. A 25% difference boundary line is shown (black line). (b) Example regions to show that the average methylation level of the 200 bp windows is similar in S0h (blue line) and S24h (violet red line). (c) The average methylation level of CGIs that were hypo-, semi- and hypermethylated in primary A549 cells. The data of 100 CGIs are shown as examples.

