Figure 2.

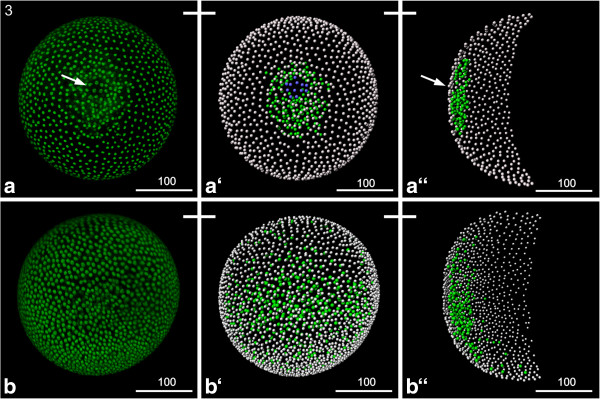
Stage 3 (Gastrulation zone): (a, b) Sytox; (a‘, a“, b‘, b“) Volume rendering. A white bar connecting two pictures point out that the same individual is shown. (a) The ring like gastrulation zone (arrow) is clearly visible. Also the larger cells, probably the germ cells, are clearly visible. (a‘) The Volume rendering shows the ectodermal cells (grey), the mesendodermal cells (green) and the larger potential germ cells (blue). (a“) Transversal view of the same construct shows that the internalized cells just start to migrate. (b) Later on the gastrulation zone starts to disappear and the internalized cells spread underneath the ectodermal cell layer. (b‘) The Volume rendering shows the ectodermal cells (grey) and the mesendodermal cells (green) continuing their migration. (b“) Transverse view of the same construct shows that the internalized cells migrated off the gastrulation zone; they spread in a bilaterally symmetrical manner more extensively towards the posterior and lateral than towards the anterior, leading to the disappearance of the gastrulation zone.
