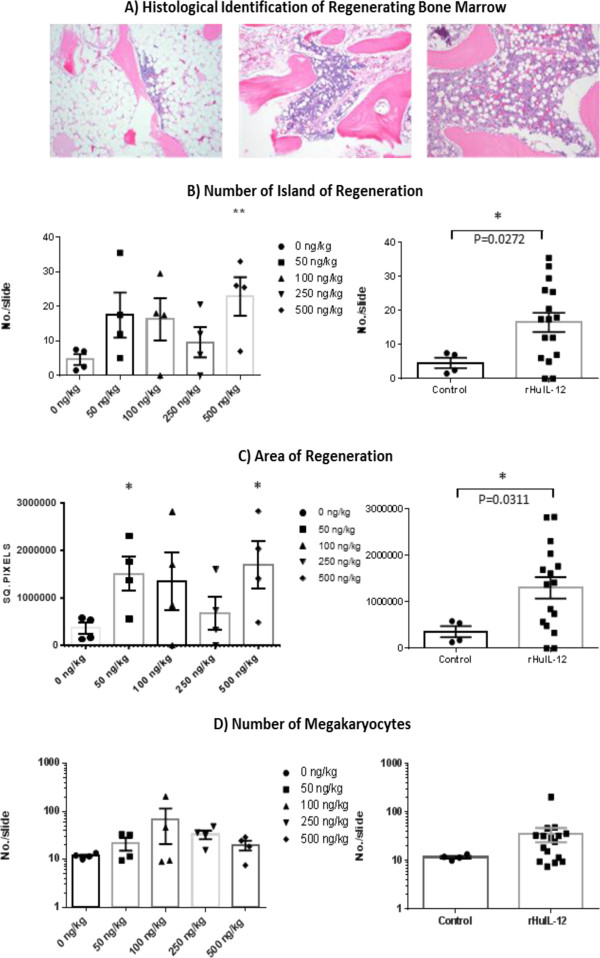
Figure 3.
Identification of Bone Marrow Regeneration Islands. (A) Histopathological identification of regenerating bone marrow. Clusters of cells appearing in otherwise ablated bone marrow were scored as one regenerating island. Left panel, ablated bone marrow; middle panel, regenerating bone marrow; right panel, non-irradiated bone marrow. (Olympus BX41 compound microscope; Infinity Analyze software v5.0, magnification: 10×). (B) Quantification of number of islands of regeneration for individual treatment groups (left panel, p < 0.01 for 500 ng/kg group vs. control) and the combined rHUIL-12-treated groups vs. vehicle-treated control (right panel, p < 0.05). (C) Quantification of area of regeneration for individual treatment groups (left panel, p < 0.05 for 50 and 500 ng/kg groups vs. control) and the combined rHuIL-12-treated groups vs. vehicle-treated control (right panel, p < 0.05). (D) Quantification of megakaryocytes for individual treatment groups (left panel) and the combined rHuIL-12-treated groups vs. vehicle-treated control (right panel).

