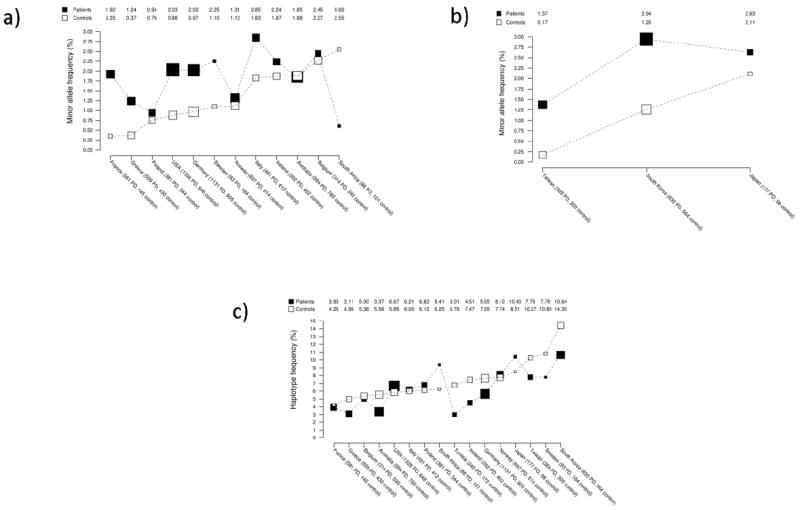
Figure 1.

Population-specific allele frequencies.
A) Minor allele (C) frequency of p.M1646T in patients with PD and controls according to country. Larger boxes indicate larger sample sizes. Countries are ordered according to minor allele frequency (lowest to highest) in controls. Minor allele frequencies are connected by dashed lines within patients with PD and controls in order to enhance visual display.
B) Minor allele (T) frequency of p.A419V in patients with PD and controls according to country in the Asian series. Larger boxes indicate larger sample sizes. Countries are ordered according to minor allele frequency (lowest to highest) in controls. Minor allele frequencies are connected by dashed lines within patients with PD and controls in order to enhance visual display.
C) Frequency of the protective p.N551K-R1398H-K1423K (G-A-A) haplotype in patients with PD and controls according to country. Larger boxes indicate larger sample sizes. Countries are ordered according to haplotype frequency (lowest to highest) in controls. Haplotype frequencies are connected by dashed lines within patients with PD and controls in order to enhance visual display.
