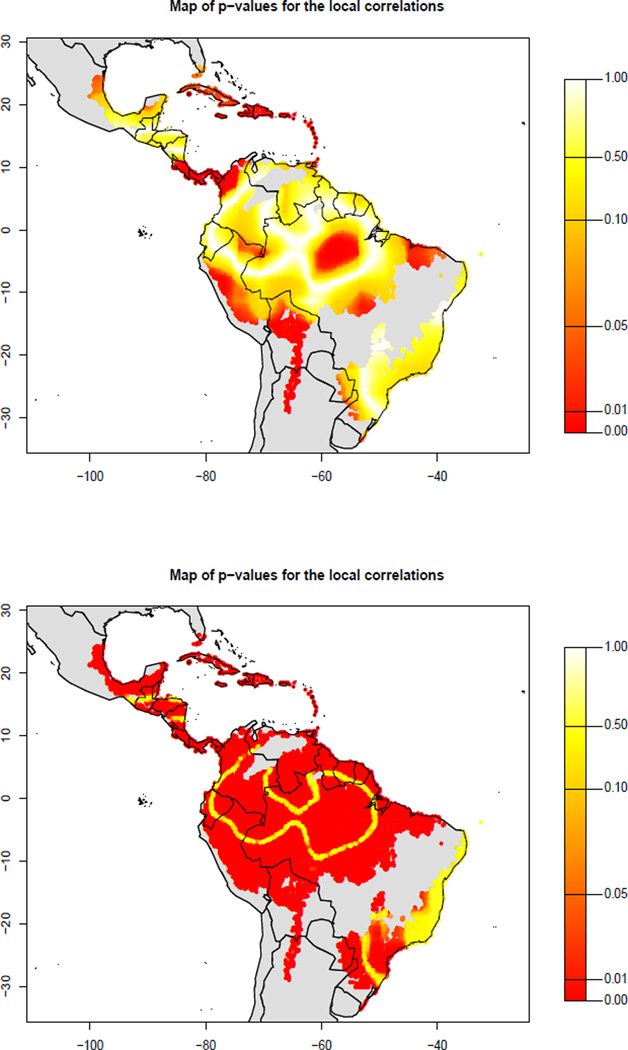
Figure 3.
Top: map of p-values for the correlations between biodiversity and remoteness in Figure 1(c), obtained with our method with B = 1000 and Δ ∈ (0.005, 0.785). Bottom: p-values map if we assume that there is no spatial autocorrelation and use the standard test to assess the local correlations.

