Figure 6.
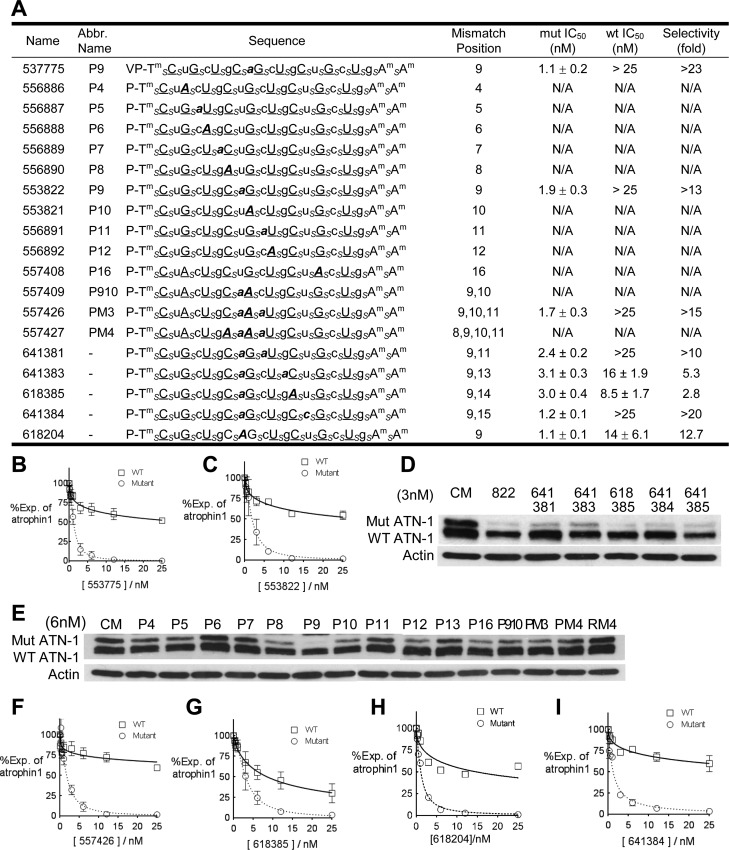
Allele-selective inhibition of ATN-1 expression by ss-siRNAs. Gels are Western analyses of ATN-1 levels. Graphs are based on triplicate determinations. CM is a control duplex RNA that is not complementary to ATN-1 mRNA. (A) Sequences, IC50 values, and selectivities of ss-siRNAs used for panels B–I. A subscript s indicates a phosphorothioate (PS) linkage. The 2′-O-methyl (2′-O-Me)-modified base is denoted in lowercase. The 2′-fluoro (2′-F) group is shown in underlined uppercase. Tm means 2′-methoxyethyl (2′-MOE)-modified RNA T. Mismatched bases are shown in bold italics. The terminal thymidine has a 5′-phosphate or vinyl phosphonate. All other linkages are phosphates. (B and C) Dose–response curves related to ss-siRNAs 553775 and 553822, respectively. (D and E) ss-siRNAs tested at 3 and 6 nM, respectively. (F–I) Dose–response curves for ss-siRNAs 557426, 618385, 618204, and 641384, respectively.

