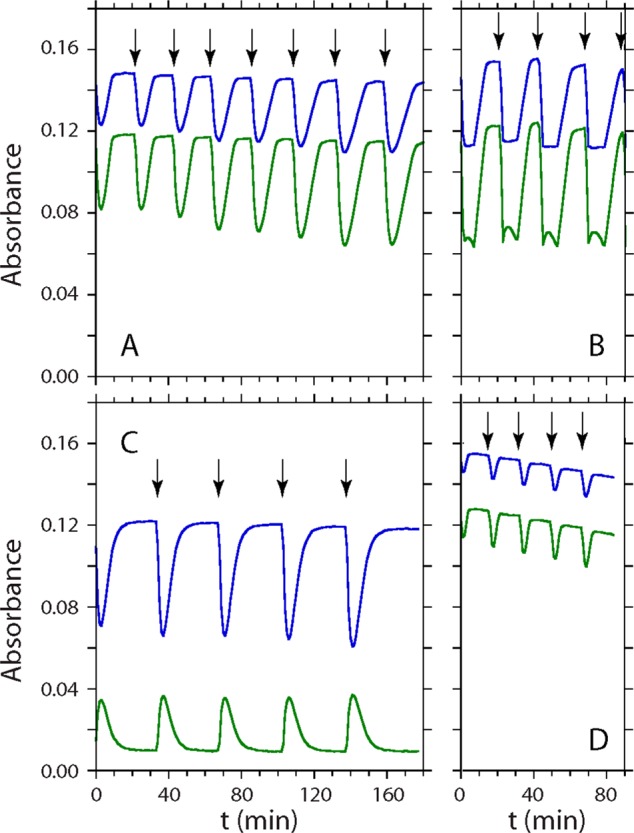
Figure 11.

NOD activity of rTHB1. The traces illustrate the temporal changes in absorbance in the visible region. Samples contained ∼10 μM protein in 100 mM phosphate buffer (pH 7.1) and a Fd/NADP+ reduction system. (A) Time traces at 545 nm (top line, blue) and 581 nm (bottom line, green) upon repeated addition of 1 equiv of MAHMA-NONOate to wild-type rTHB1-O2. The first addition occurred at time zero; subsequent additions are marked by vertical arrows. (B) Same as panel A, using 1.5 equiv of MAHMA-NONOate. The additional minor phase during the “turnover” period corresponds to buildup and decay of the ferric–nitrosyl adduct. (C) Time trace at 545 nm (blue) and 633 nm (green) upon repeated addition of 1 equiv of MAHMA-NONOate to K53A rTHB1-O2. (D) Time trace at 545 nm (blue) and 581 nm (green) upon repeated addition of 1 equiv of MAHMA-NONOate to Y29F rTHB1-O2.
