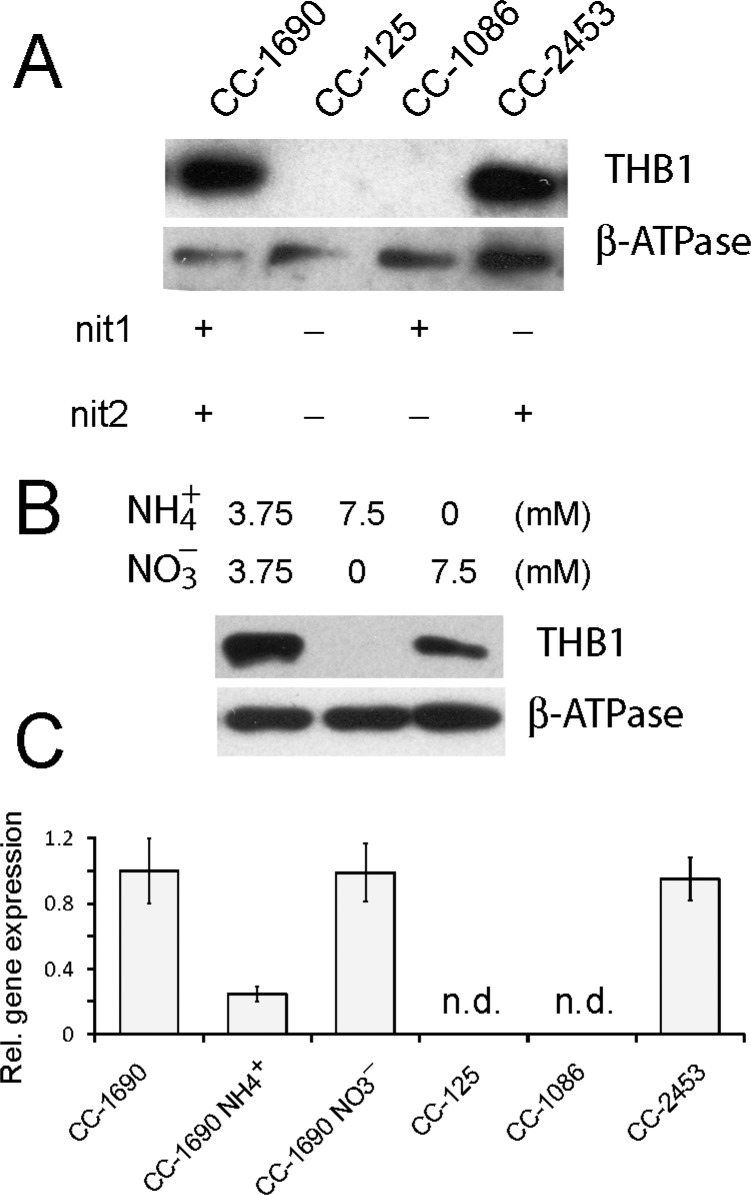
Figure 12.
Variation in THB1 protein levels and THB1 gene expression. (A) Western blot of whole cell extracts from C. reinhardtii strains CC-1690, CC-125, CC-1086, and CC-2453 probed with antibodies to THB1. All strains were grown in Sager-Granick M medium. The β subunit of the ATP synthase was used as a loading control. (B) Western blot of whole cell extracts probed with antibodies to THB1. Cells are from strain CC-1690 grown in Sager-Granick M medium with modifications to the nitrogen source in the media as indicated. The β subunit of the ATP synthase was used as a loading control. (C) Transcript abundances of THB1 relative to CBLP, as determined by qPCR. Averages ± the standard deviation of three independent experiments performed on a mixture of biological duplicates are shown (nd, not detected). All samples were grown in Sager-Granick M medium except “NH4+” and “NO3–”, which are strain CC-1690 grown in ammonium and nitrate, respectively, as in panel B.

