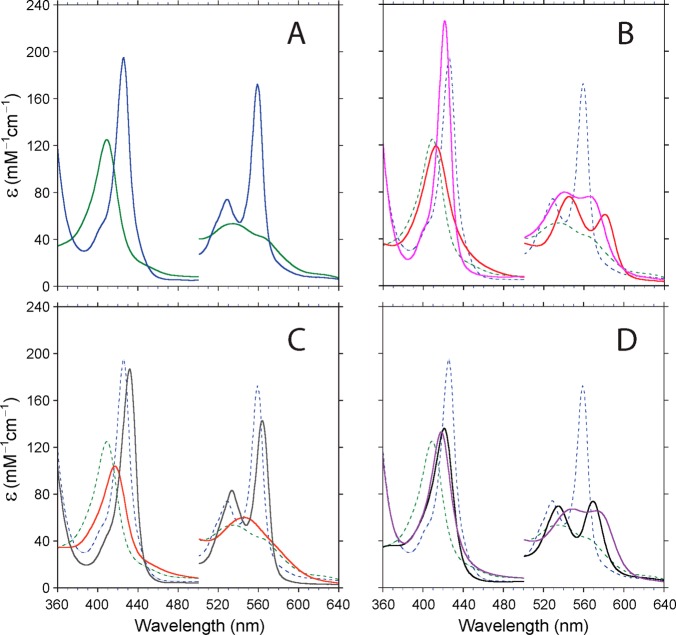
Figure 3.
Absorption spectra of various forms of rTHB1 (∼10 μM, 100 mM phosphate buffer, pH 7.1). The vertical scale was adjusted to provide the extinction coefficient, ε in mM–1 cm–1. The intensity of the α–β band region was magnified by a factor of 5. (A) Ferric (green) and ferrous (blue) proteins at pH 7.1. These two spectra are reproduced with dashed lines in panels B–D. (B) Oxy (red) and carbonmonoxy (magenta) states. (C) Cyanide complexes of the ferrous (gray) and ferric (orange) states. (D) NO• adducts of the ferrous (purple) and ferric (black) states.

