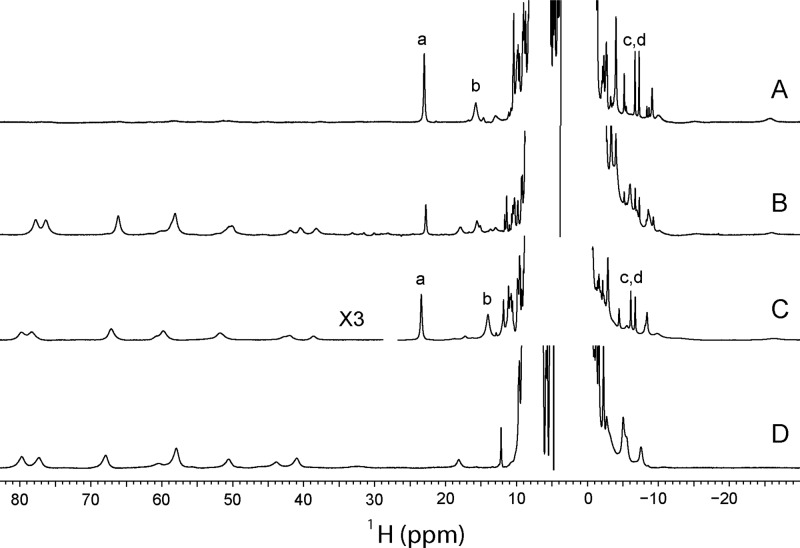
Figure 6.
One-dimensional 1H spectra of ferric rTHB1: (A) wild type at pH 7.6 (∼9% high-spin), (B) wild type at pH 5.4 (intensity ×4 compared to trace A, ∼90% high-spin), (C) Y29F variant at pH 7.0 (intensity of downfield region ×3, ∼40% high-spin), and (D) K53A variant at pH 7.4. Resonances marked a–d correspond to the 3-CH3, 8-CH3, and 2-vinyl βtrans and βcis protons, respectively, from the low-spin wild-type and Y29F species. Data were recorded in a 10% 2H2O/90% 1H2O mixture at 298 K.

