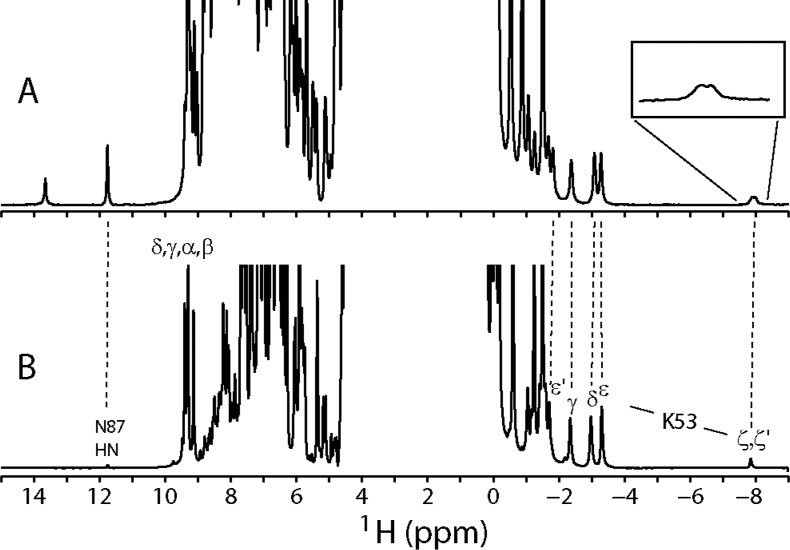
Figure 7.
1H spectra of ferrous rTHB1. One-dimensional spectra of (A) 15N-labeled wild-type rTHB1 in a 90% 1H2O/10% 2H2O mixture (pH 9.5) with amide 15N decoupling (120 ppm) during acquisition and (B) Y29F rTHB1 in a 10% 1H2O/90% 2H2O mixture (pH* 9.2). Heme meso, Asn87 NH, and resolved Lys53 signals are labeled.

