
Figure 9.
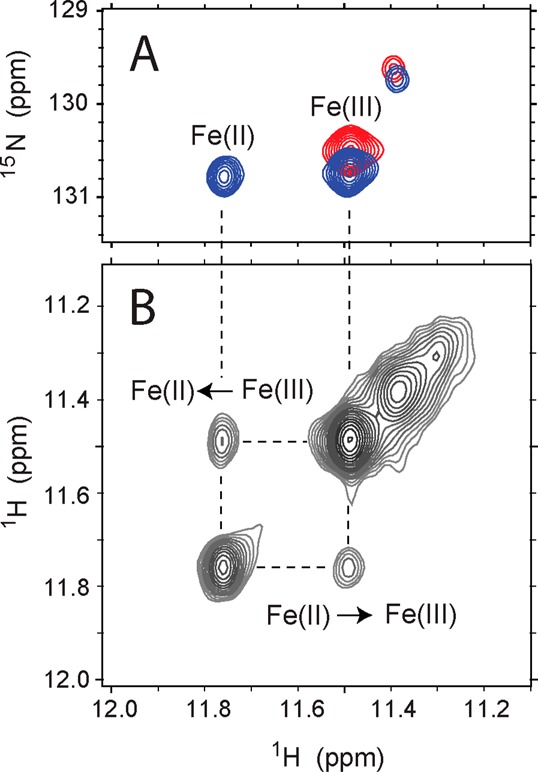
ESE in wild-type rTHB1. (A) Portion of a 1H–15N HSQC spectrum collected on a 3:7 mixture of ferrous and ferric rTHB1 (blue, 1.8 mM rTHB1, pH 9.2, 298 K) superimposed over that of a sample of pure ferric rTHB1 (red, pH 7.5, 298 K). The cross peaks are from Asn87 NH. (B) Matching region of a 1H–(15NZ)–1H ZZ exchange NMR spectrum (τmix = 701 ms) recorded on the ferrous/ferric mixture. The square pattern is caused by redox interconversion.