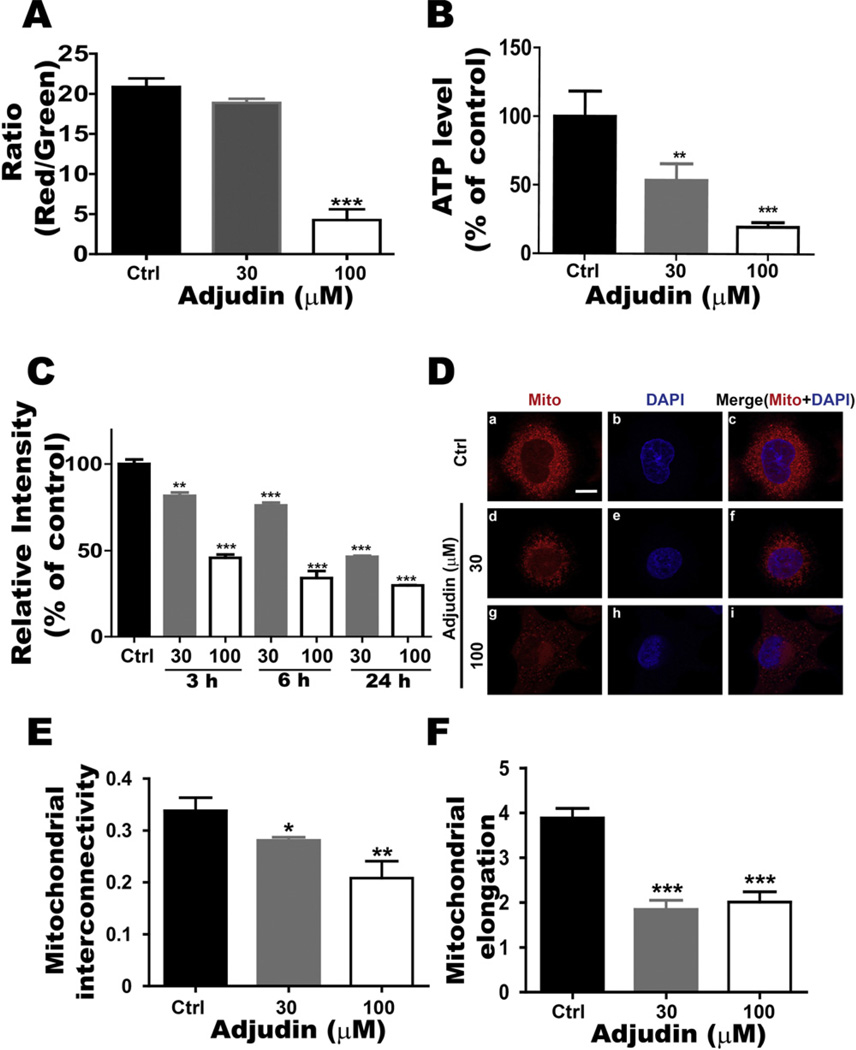
Fig. 6.
Adjudin affected mitochondrial function. (A) Flow cytometric assays of JC-1 staining were used to measure the mitochondrial membrane potential after 24 h treatment of Adjudin at different concentrations in A549 cells. Functional mitochondria containing J-aggregates (JC-1 aggregates) were stained fluorescent red (FL2 channel), whereas damaged mitochondria containing J-monomers (JC-1 monomers) were stained green (FL1 channel). The ratio of FL2/FL1 was plotted against the Adjudin concentrations. (B) After treatment with Adjudin for 24 h, the ATP levels of A549 cells were detected by the ATP assay as described in Section 2. The ATP concentration of each sample was calculated using an ATP standard, and normalized against the control. (C) A549 cells treated with Adjudin for 3 h, 6 h and 24 h were stained with MitoTracker Green and analyzed by flow cytometry to determine the mitochondrial mass. The MitoTracker Green intensity was plotted against the Adjudin concentrations and normalized against the control. (D) Mitochondrial (Mito) morphology was evaluated by using MitoTracker probe with Adjudin treatment at increasing concentrations for 6 h. Mitochondria and nuclei were stained by MitoTracker probe (red)or DAPI (blue), respectively. The scale bar shown in (a) is 10 µM. (E.F.) Morphometry quantification demonstrating the effects of Adjudin on the mitochondrial interconnectivity (mean area/perimeter ratio, E) and the mitochondrial elongation index (inverse circularity, F) of A549 cells at 6 h. The quantification of mitochondrial morphology was performed employing the custom macro for NIH ImageJ software as described previously (n = 30–50 cells analyzed per condition with at least three independent experiments) [19].
*P < 0.05, **P < 0.01 and ***P < 0.001 indicate significant differences from the respective control groups compared by one-way ANOVA to be followed Tukey’s Honest Significant Test.

