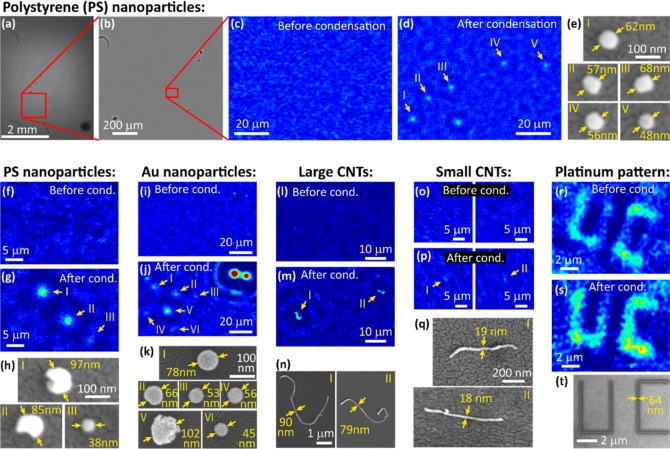
Figure 2.
Nano-objects imaged with the aid of vapor-condensed nanolenses. (a–e) Detection of polystyrene nanoparticles. The full field of view hologram is shown in (a), with a super-resolved zoom-in in (b). The reconstructed phase image of a region of interest is shown in (c), where no particles are visible because their holographic signals are too weak. After the condensation of nanolenses, individual particles in the same region of interest become visible in (d). SEM is used to verify the size of the particles that were detected (e). (f–h) Another region of interest with polystyrene particles. This region shows two larger, irregular particles, along with a particularly small, sub-40 nm particle. (i–k) Detection of gold nanoparticles. In addition to these nanoparticles, this region of interest includes two very large dust particles, which can be seen in both the “before” image (i) and the “after” image (j), showing that the two images are correctly registered. (l–n) Imaging of large, multiwalled carbon nanotubes, where the curved shapes of the nanotubes are visible. (o–q) Detection of smaller multiwalled carbon nanotubes with diameters below 20 nm. These tubes are too short for their shape to be correctly resolved; however they are still detectable. (r–t) Imaging of a platinum pattern deposited on an indium–tin-oxide substrate using a focused electron beam. Although parts of this pattern are still visible in the “before” image, the contrast is significantly improved by condensation of nanolenses. Throughout the entire figure, for each pair of “before” and “after” images, the same color map is used for both figures, although the working distance, z2, may be slightly different (see the Materials and Methods section).

