Figure 8.

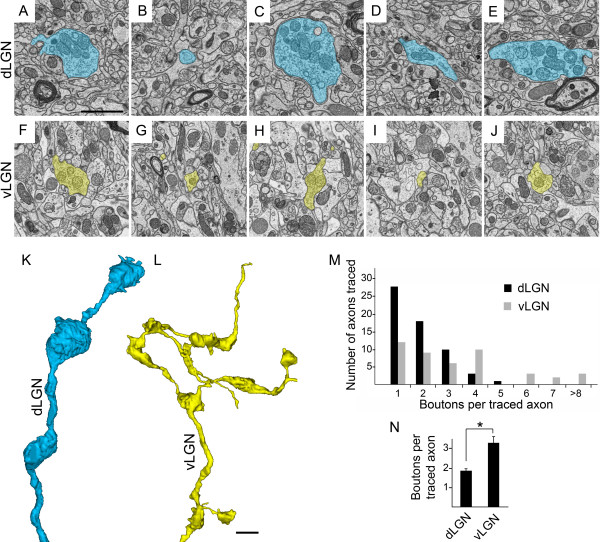
Ultrastructural analysis of numbers of terminals per retinal axon in subnuclei of mouse visual thalamus. A-J. Serial block face scanning electron microscope (SBFSEM) micrographs show multiple terminal boutons and axons from a single retinal axon in dLGN (A-E) and vLGN (F-J). K, L. 3D reconstructions of axonal arbors from A-E (see K) and F-J (see L). These reconstructions are at the same scale and represent entire axonal arbors from dorsal lateral geniculate nucleus (dLGN) and ventral lateral geniculate nucleus (vLGN) datasets that were 40 μm by 40 μm by 15 μm. M. Numbers of terminal boutons were counted in each axon traced in dLGN and vLGN (n = 3 datasets per tissue regions; 59 axons in dLGN, 44 axons in vLGN). Retinal axons in dLGN datasets contain fewer terminal boutons than those in vLGN. N. Quantitation of the mean numbers of terminal boutons per axon in dLGN and vLGN. Axons traced in dLGN contain a significantly smaller number of terminal boutons than those in vLGN (P <0.00005 by Student t-test). Scale bar in A = 1 μm for A-J and in L = 1.5 μm for K,L.
