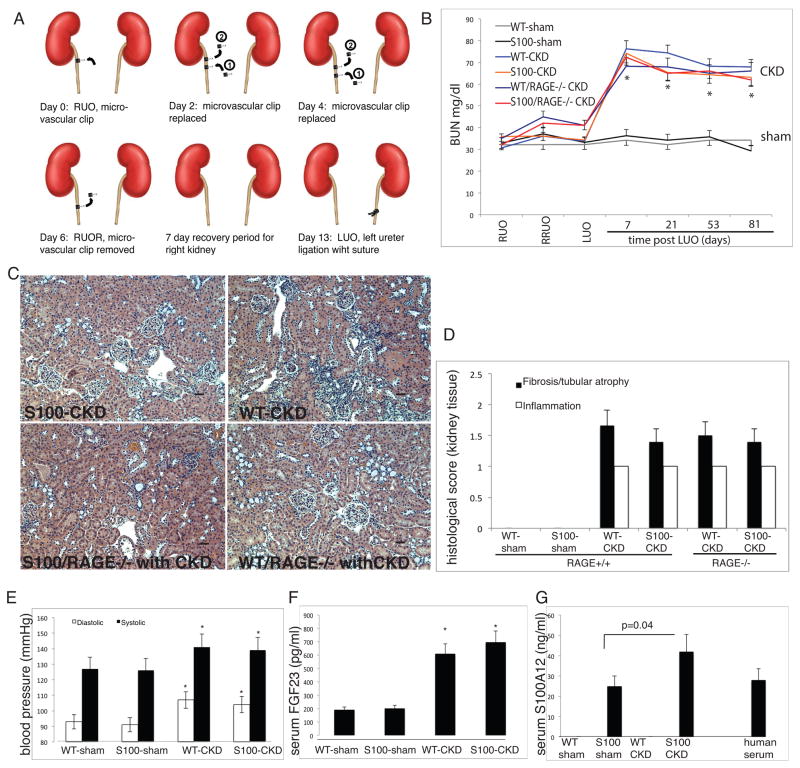
Figure 2. Model of CKD in hBAC-S100 and WT littermate mice.
A) Reversible surgical ligation of the right ureter followed by irreversible ligation of the left ureter. B) BUN was measured in the serum at various time points until sacrifice as an indicator for developing CKD after reversible right ureter obstruction (RUO) for 6 days, followed by release of RUO (RRUO), followed 7 days later by irreversible left ureter obstruction (LUO). * P=0.001 vs. sham). C/D) Representative H&E stained slides of the right kidney were scored for interstitial fibrosis with tubular atrophy, and for interstitial inflammation using scores of 0–3 for semi-quantitative assessment with 0 =<5%, 1= 6–25%, 2= 26–50%, and 3=>50% involvement. There was no difference in renal pathology between the four CKD groups. Scale bar 10 μm. E) Systolic and diastolic blood pressure were measured in the tail artery (* P=0.04 vs. respective sham group). F) Serum FGF23 and S100A12 (G) were measured by ELISA (* P=0.01 vs. respective sham group). All values are mean ±SEM, n>20 mice per group.

