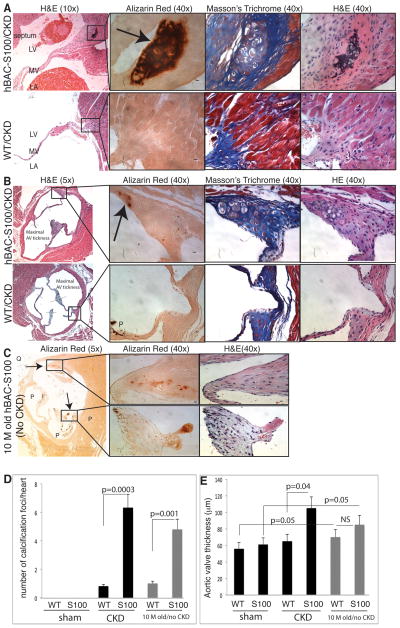
Figure 4. hBAC-S100 mice with CKD develop ectopic cardiac calcification.
A) Serial stained sections of the mitral valve of hBAC-S100 (upper panel) and WT mice (lower panel) and B) of the aortic valve of hBAC-S100 (upper panel) and WT mice (lower panel). Serial sections were stained for hematoxylin and eosin (H&E), Alizarin Red S staining calcium deposits in red color as marked by arrow, and Masson’s Trichrome. P=pigment, Scale bar 10 μm. C) Cardiac calcification developed spontaneously in 10-month-old hBAC-S100 mice (without CKD and on regular rodent chow diet) as shown by red color on Alizarin Red S stained sections of the aortic valve and co-localizing to hypertrophic chondroblast-like cells (upper panel in C), and to calcification on the valve leaflet tip (lower panel in C). D) Red-colored calcification foci (shown by arrow) but not the black-colored pigment deposition (marked as P) on Alizarin Red S-stained serial sections (n= 50–70 per heart) were counted from the apex to the ascending aorta. E) Quantification of the maximal aortic valve thickness of the three leaflets measured as depicted in panel B. All values are mean ±SEM, n=10 mice per group.

