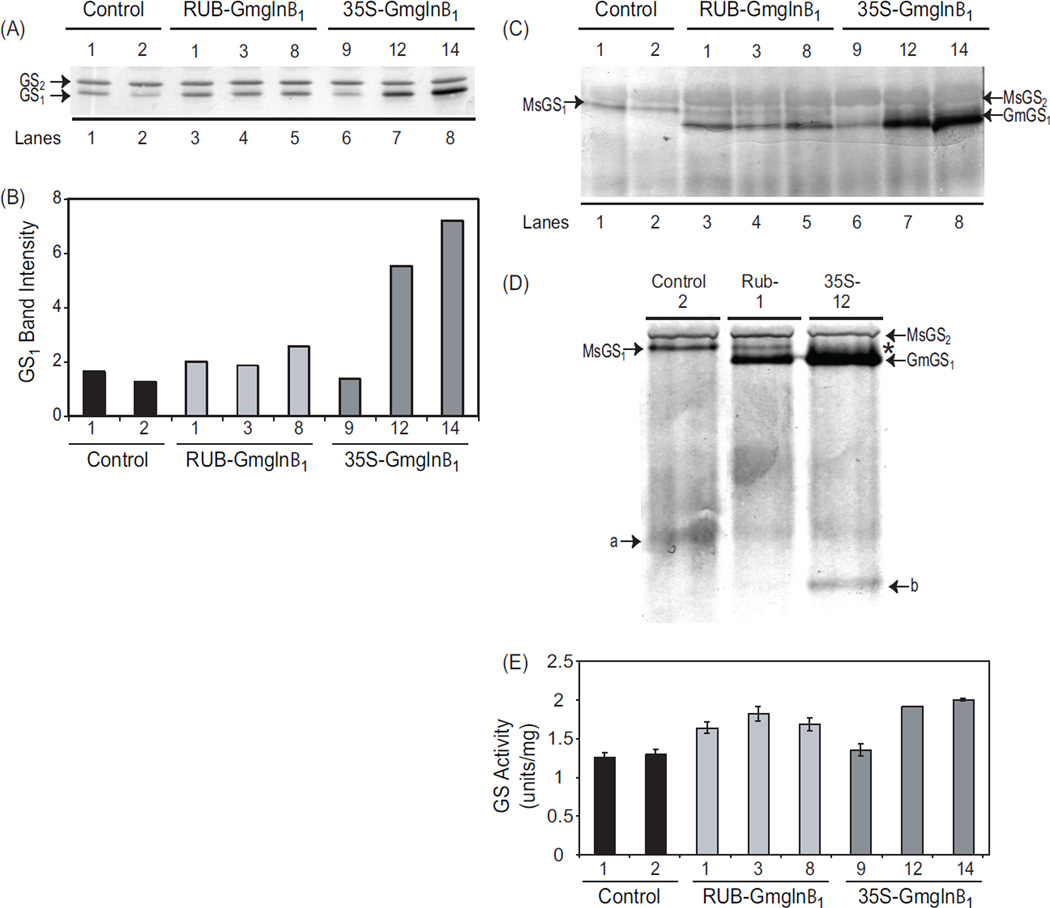
Fig. 3.
Analysis of GS polypeptide, holoenzyme and GS activity in the leaves of RUB-Gmglnβ1 and CaMV35S-Gmglnβ1 alfalfa transformants. (A) Five µg of protein from leaf extracts of alfalfa control plants and independent transformants with the RUB-Gmglnβ1 and CaMV35SGmglnβ1 gene constructs was subjected to SDS PAGE followed by western blot analysis using anti-GS antibodies. Immunoreactive bands corresponding to GS1 (39–40 kd) and GS2 (42–43 kd) polypeptides are shown. (B) Band intensities of the GS1 band from panel A is plotted. (C) Twenty five µg of of leaf extracts from the same plants as in panel A were subjected to native gel electrophoresis followed by western blot analysis using anti-GS antibodies. Immunoreactive bands corresponding to the endogenous GS2 (MsGS2) and GS1 (MsGS1) and the transgene product (GmGS1) are designated. (D) Close-up of a immunoreactive native gel profile of leaf protein from control, RUB-Gmglnβ1 (#1) and CaMV35S-Gmglnβ1 (#12) transformants showing the bands corresponding to the endogenous MsGS2 and MsGS1, and the transgene product GmGS1. Asterisk represents the broad immunoreactive band probably representing a mixture of heteromers made of the endogenous GS1 and the transgene product. Bands a and b represent the turnover products of the MsGS and GmGS1 holoproteins respectively. (E) GS activity was measured in the leaf protein samples used for western analysis in panel A. Average values ±SE of three experiments were plotted as µmol γ-glutamyl hydroxamate produced per minute per mg of protein at 30° C.

