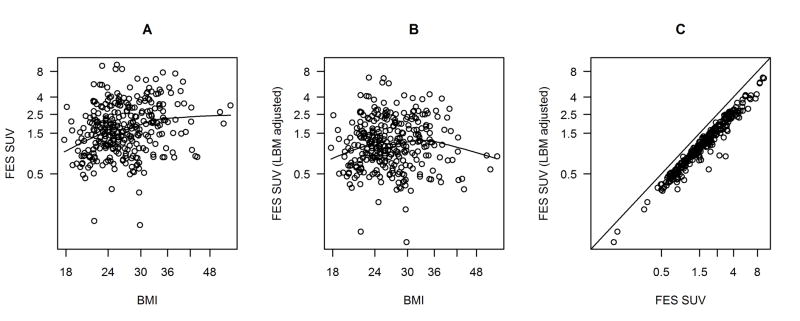
Figure 3.

Exploring the relationship between BMI and FES SUV: log(FES SUV) plotted against log(BMI) (A); log of lean body mass-adjusted FES SUV plotted against log(BMI) (B); comparison of FES SUV and lean body mass-adjusted FES SUV (C), with line showing equality. Fitted curves are locally weighted scatterplot smoothing (LOWESS) with smoother span 2/3.
