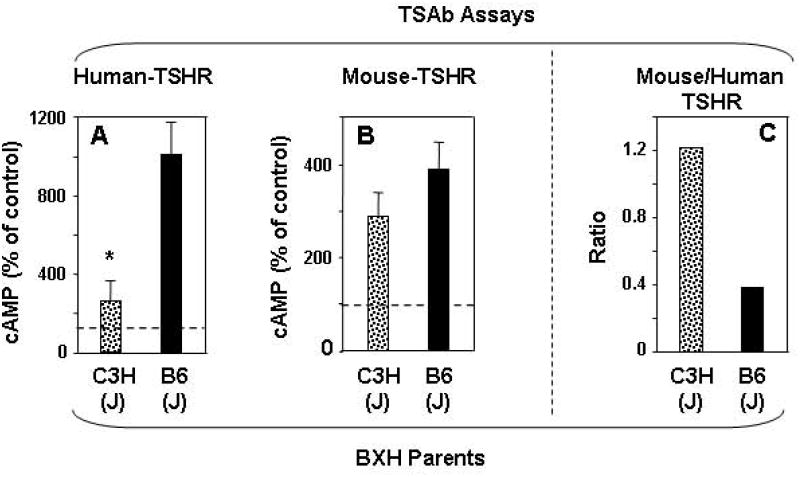
Figure 1.

TSAb specific for the mouse-TSHR and the human-TSHR in parental strains of BXH mice, C3H and B6 mice. Sera were tested one week after two immunizations with A subunit-Adenovirus. A) Human -TSHR TSAb (previously reported in 14; B) Mouse-TSHR TSAb; C) Ratio of mouse-TSHR:human-TSHR TSAb. TSAb values (mean + SEM) are expressed as % cAMP generated sera from control adenovirus immunized mice; indicated by dashed lines (panels A, B); number of mice C3H, n=10; B6, n=10; * p =0.006 (Rank sum test) . The TSAb ratios were calculated from the means for mouse- and human-TSHR TSAb.
