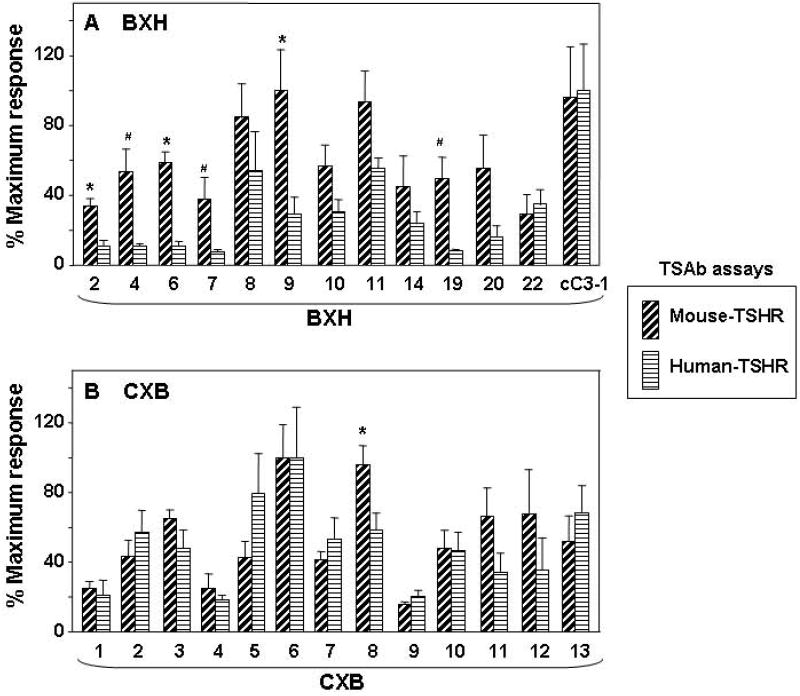
Figure 2.

Comparison of mouse-TSHR TSAb versus human-TSHR TSAb in recombinant inbred strains BXH (panel A) and CXB (panel B) after two immunizations with A-subunit (human)-Adenovirus. The data are shown as paired bar graphs (mean + SEM) of mouse-TSHR TSAb and human-TSHR TSAb for each strain. Because the maximum stimulation was higher with the human-TSHR than with the mouse-TSHR, TSAb values were expressed as a percentage of the mean maximum levels attained as follows:- BXH strains, mouse-TSHR 485% (BXH9) and human-TSHR 1229% (BXHcC3-1); CXB strains:- mouse-TSHR 555 % (CXB6) and human-TSHR 945% (CXB6). Significant differences between mouse- and human-TSHR TSAb:- A) * p<0.019 (t test), # p<0.010 (rank sum test); B), * p=0.030 (t test).
