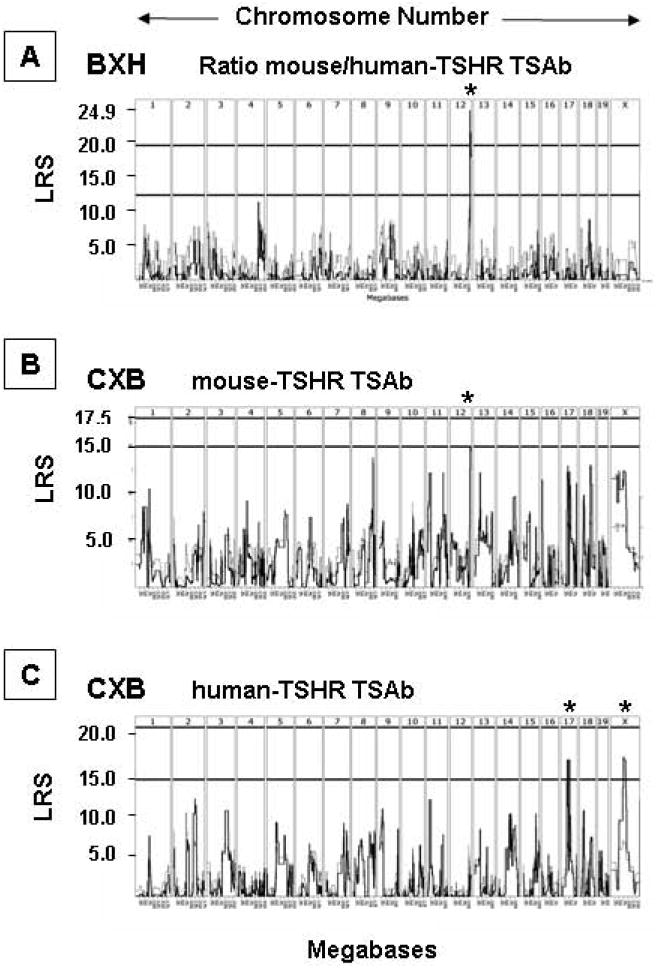
Figure 3.

Whole genome interval mapping in BXH and CXB strains for TSAb traits after two A-subunit-Ad immunizations: A) human-TSHR TSAb in CXB mice; B) mouse-TSHR TSAb in CXB mice; C) Ratio mouse:human (m:h) TSHR TSAb in BXH mice. Chromosomes 1 to 19 and X are indicated at the top of each panel and likelihood ratio statistics (LRS) values on the vertical axis. The horizontal lines (panels A and C) indicate the LRS values above which a trait is associated with a particular chromosome [indicated by asterisk(s)]. In panel A, the upper horizontal line indicates the level for a significant association. GeneNetwork identifiers: A) GN 10683; B) GN 10685; C) GN 10157.
