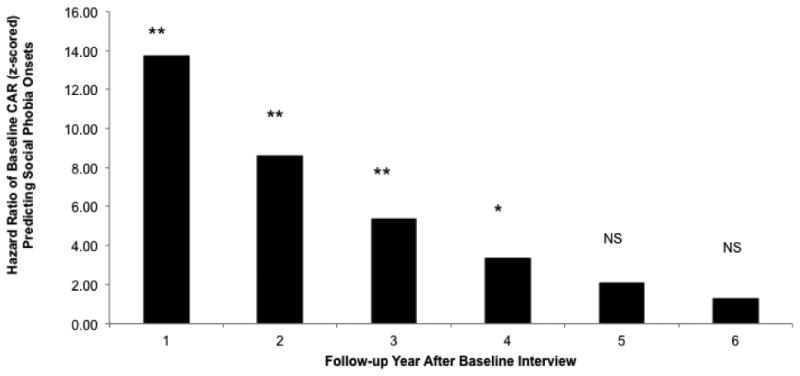
Figure 2.

Model-estimated hazard ratios illustrate the observed CAR × Time interaction predicting social anxiety disorder onsets. Bars represent HRs for z-scored baseline natural log transformed CAR in year intervals after baseline. * = p < .05, ** = p < .01, NS = not significant, p > .05.
